# Technical Document Extraction: HotPotQA Success Rate Analysis
## Chart Overview
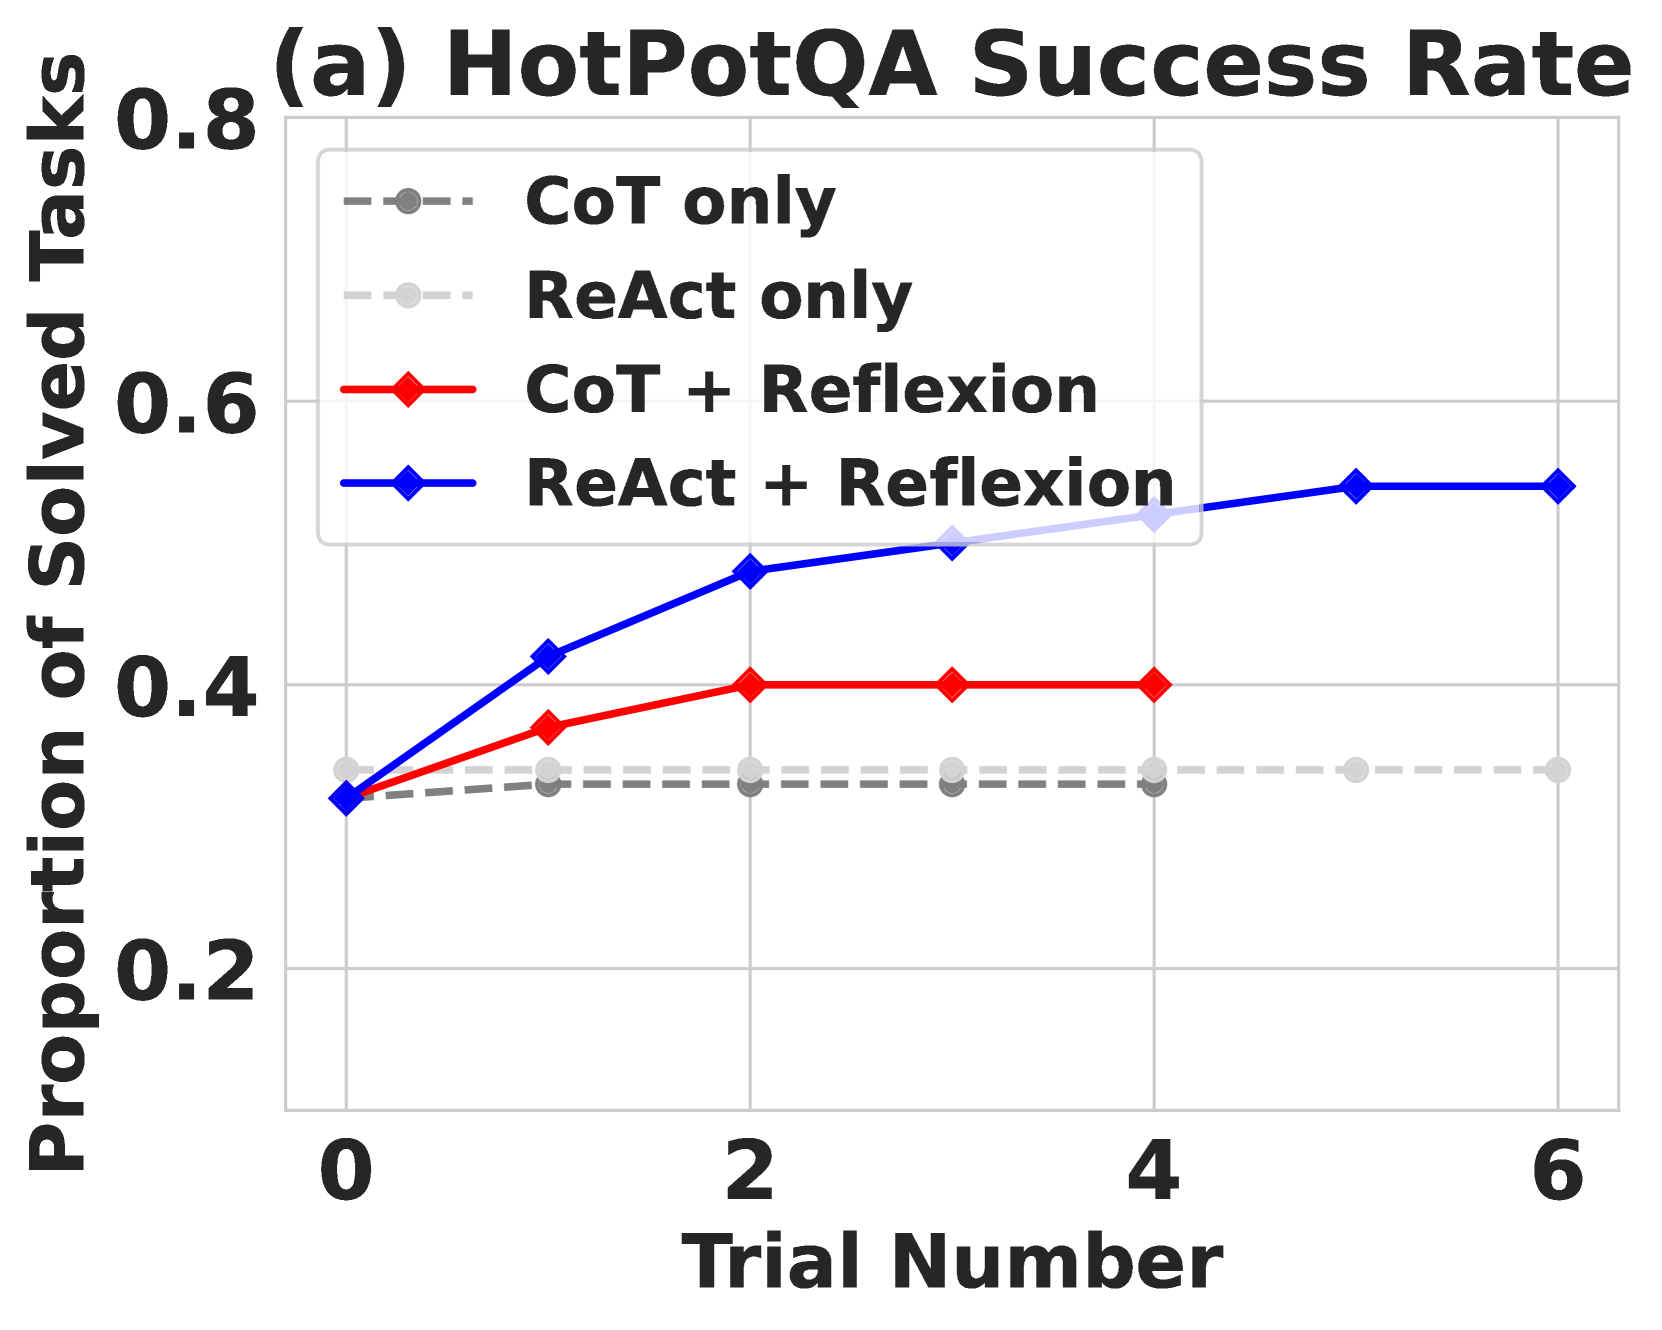
- **Title**: (a) HotPotQA Success Rate
- **Type**: Line graph
- **Purpose**: Visualizes performance trends of different reasoning strategies across trials
## Axes
- **X-axis**: Trial Number
- Markers: 0, 2, 4, 6
- Label: "Trial Number" (bold, black text)
- **Y-axis**: Proportion of Solved Tasks
- Range: 0.2 to 0.8 (increments of 0.2)
- Label: "Proportion of Solved Tasks" (bold, black text)
## Legend
- **Location**: Right side of chart
- **Entries**:
1. `CoT only` → Gray dashed line with circle markers
2. `ReAct only` → Gray dotted line with circle markers
3. `CoT + Reflexion` → Red solid line with diamond markers
4. `ReAct + Reflexion` → Blue solid line with diamond markers
## Data Trends
1. **CoT only** (Gray dashed):
- Starts at ~0.32 (trial 0)
- Gradual increase to ~0.34 (trial 2)
- Plateaus at ~0.34 (trials 4–6)
2. **ReAct only** (Gray dotted):
- Starts at ~0.32 (trial 0)
- Slight increase to ~0.34 (trial 2)
- Remains stable at ~0.34 (trials 4–6)
3. **CoT + Reflexion** (Red solid):
- Starts at ~0.32 (trial 0)
- Sharp rise to ~0.42 (trial 2)
- Stabilizes at ~0.42 (trials 4–6)
4. **ReAct + Reflexion** (Blue solid):
- Starts at ~0.32 (trial 0)
- Steep ascent to ~0.55 (trial 6)
- Consistent upward trajectory across all trials
## Key Observations
- **Performance Gaps**:
- `ReAct + Reflexion` outperforms all other strategies by trial 6 (~0.55 vs. ~0.42 max for others).
- `CoT + Reflexion` shows the fastest initial improvement but plateaus earlier.
- **Baseline Consistency**:
- `CoT only` and `ReAct only` exhibit minimal change across trials, suggesting limited adaptability.
- **Marker Consistency**:
- Diamond markers (red/blue) align with higher-performing strategies; circle markers (gray) with baseline methods.
## Data Points Summary
| Trial | CoT only | ReAct only | CoT + Reflexion | ReAct + Reflexion |
|-------|----------|------------|-----------------|-------------------|
| 0 | ~0.32 | ~0.32 | ~0.32 | ~0.32 |
| 2 | ~0.34 | ~0.34 | ~0.42 | ~0.46 |
| 4 | ~0.34 | ~0.34 | ~0.42 | ~0.51 |
| 6 | ~0.34 | ~0.34 | ~0.42 | ~0.55 |
## Technical Notes
- **Line Styles**:
- Dashed (CoT only) vs. Dotted (ReAct only) vs. Solid (combined strategies).
- **Color Coding**:
- Red/Blue for combined strategies; Gray for single-method baselines.
- **Marker Shape**:
- Circles for single-method lines; Diamonds for combined strategies.