## Flowchart: Error Detection and Correction Process in Model Responses
### Overview
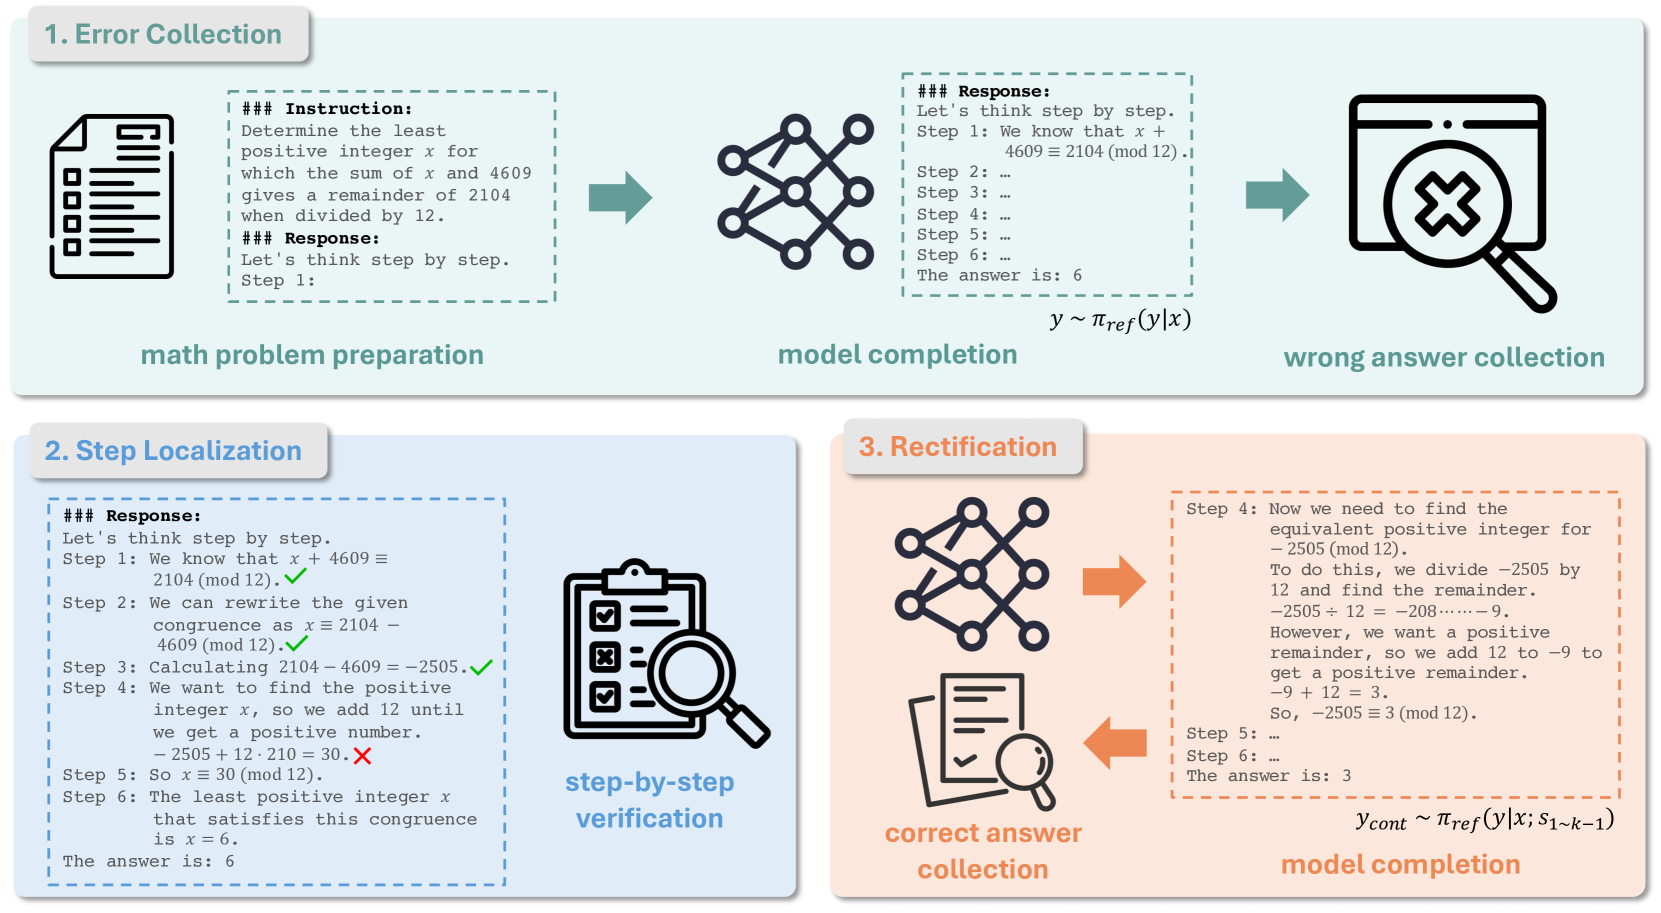
The image depicts a three-stage flowchart illustrating the process of identifying, localizing, and rectifying errors in model-generated responses to math problems. It combines textual instructions, neural network diagrams, and symbolic verification elements to demonstrate error handling in computational systems.
### Components/Axes
1. **Error Collection Section** (Top)
- **Math Problem Preparation**: Text box with instruction to find the least positive integer x satisfying (x + 4609) ≡ 2104 (mod 12)
- **Model Completion**: Neural network diagram (y ~ π_ref(y|x))
- **Wrong Answer Collection**: Icon of magnifying glass over X symbol
2. **Step Localization Section** (Left)
- **Step-by-Step Verification**: Checklist with mixed green checkmarks and red X
- **Critical Error**: Step 4 marked with red X (incorrect calculation: -2505 + 12·210 = 30)
3. **Rectification Section** (Right)
- **Correct Answer Collection**: Text box showing corrected response (answer = 3)
- **Model Completion**: Neural network diagram (y_cont ~ π_ref(y|x; s₁₋ₖ₋₁))
- **Flow Arrows**: Orange bidirectional arrows connecting error detection to correction
### Detailed Analysis
1. **Error Collection**
- Initial problem: Find x where (x + 4609) ≡ 2104 (mod 12)
- Incorrect model response: x = 6 (Step 6)
- Error visualization: Red X over incorrect answer
2. **Step Localization**
- Step 1-3: Correct calculations (congruence transformations)
- Step 4: Critical error in arithmetic (incorrect remainder handling)
- Step 5-6: Correct conclusion despite earlier error
3. **Rectification**
- Corrected response: x = 3
- Revised model completion with additional context (s₁₋ₖ₋₁)
- Orange arrows show correction pathway from error to solution
### Key Observations
- **Error Propagation**: Single arithmetic error in Step 4 invalidates subsequent steps despite correct congruence logic
- **Verification Gaps**: Step 5-6 shows model's ability to recover from intermediate errors
- **Model Adaptation**: Rectification phase introduces contextual parameters (s₁₋ₖ₋₁) for improved completion
- **Visual Hierarchy**: Color coding (green/red) and iconography (checkmarks/X) create immediate error detection cues
### Interpretation
This flowchart demonstrates a systematic approach to error handling in computational problem-solving:
1. **Error Collection** establishes baseline problem parameters and initial (incorrect) model output
2. **Step Localization** uses structured verification to pinpoint error origins (Step 4)
3. **Rectification** shows model adaptation through contextual parameter inclusion (s₁₋ₖ₋₁)
The process highlights the importance of:
- Step-by-step verification in complex calculations
- Model architecture modifications for error recovery
- Visual feedback mechanisms (color coding, icons) for error detection
- Contextual parameterization to improve model robustness
The correction from x=6 to x=3 demonstrates how intermediate errors can be resolved through systematic verification and model adaptation, emphasizing the value of multi-stage error handling in computational systems.