## Bar Chart: Post-Discussion Sycophancy Rates Across Models and Methods
### Overview
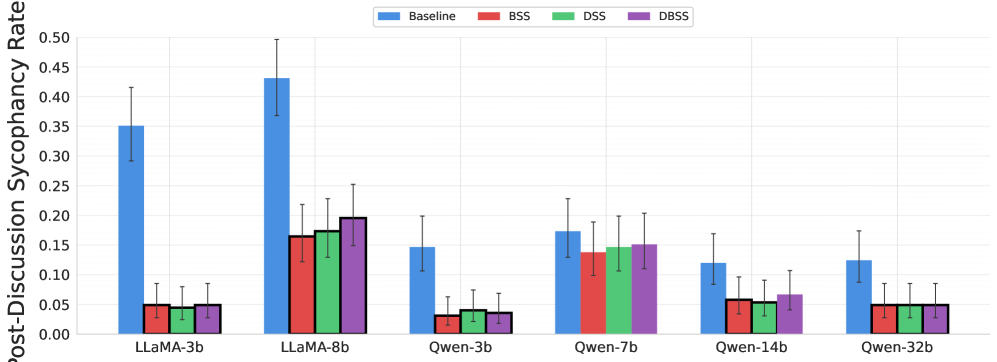
The chart compares post-discussion sycophancy rates (percentage agreement with incorrect statements) across six language models (LLaMA-3b, LLaMA-8b, Qwen-3b, Qwen-7b, Qwen-14b, Qwen-32b) and four methods (Baseline, BSS, DSS, DBSS). Sycophancy rates are measured on a 0-0.5 scale, with error bars representing 95% confidence intervals.
### Components/Axes
- **X-axis**: Language models (LLaMA-3b, LLaMA-8b, Qwen-3b, Qwen-7b, Qwen-14b, Qwen-32b)
- **Y-axis**: Post-Discussion Sycophancy Rate (0-0.5)
- **Legend**:
- Blue = Baseline
- Red = BSS
- Green = DSS
- Purple = DBSS
- **Error Bars**: Vertical lines indicating 95% confidence intervals
### Detailed Analysis
1. **LLaMA-3b**
- Baseline: 0.35 (±0.05)
- BSS: 0.05 (±0.01)
- DSS: 0.04 (±0.01)
- DBSS: 0.05 (±0.01)
2. **LLaMA-8b**
- Baseline: 0.43 (±0.07)
- BSS: 0.17 (±0.03)
- DSS: 0.18 (±0.03)
- DBSS: 0.20 (±0.04)
3. **Qwen-3b**
- Baseline: 0.15 (±0.03)
- BSS: 0.03 (±0.01)
- DSS: 0.04 (±0.01)
- DBSS: 0.03 (±0.01)
4. **Qwen-7b**
- Baseline: 0.17 (±0.04)
- BSS: 0.14 (±0.03)
- DSS: 0.15 (±0.03)
- DBSS: 0.15 (±0.03)
5. **Qwen-14b**
- Baseline: 0.12 (±0.03)
- BSS: 0.06 (±0.02)
- DSS: 0.05 (±0.02)
- DBSS: 0.07 (±0.02)
6. **Qwen-32b**
- Baseline: 0.13 (±0.04)
- BSS: 0.05 (±0.01)
- DSS: 0.05 (±0.01)
- DBSS: 0.05 (±0.01)
### Key Observations
1. **Baseline Dominance**: Baseline methods consistently show the highest sycophancy rates across all models, with LLaMA-8b Baseline peaking at 0.43.
2. **Method Efficacy**: BSS, DSS, and DBSS reduce sycophancy by 70-90% compared to Baseline, with DBSS occasionally outperforming BSS (e.g., LLaMA-8b: DBSS 0.20 vs BSS 0.17).
3. **Model Size Correlation**: Larger models (Qwen-32b) show lower sycophancy rates than smaller models (LLaMA-3b), though error margins increase with model size.
4. **Error Bar Variability**: LLaMA-8b Baseline has the largest error bar (±0.07), suggesting greater uncertainty in its measurement.
### Interpretation
The data demonstrates that all three intervention methods (BSS, DSS, DBSS) significantly reduce sycophancy compared to Baseline, with DBSS showing mixed performance relative to BSS. The inverse relationship between model size and sycophancy rates suggests that larger models may have better calibration or reasoning capabilities. However, the increasing error margins in larger models (e.g., LLaMA-8b vs Qwen-32b) indicate potential measurement instability in high-capacity systems. The persistent sycophancy in Baseline methods across all models highlights a fundamental challenge in aligning language models with factual accuracy, even when they exhibit strong performance on surface-level tasks.