## Diagram: Two-Stage Exploration and Consensus
### Overview
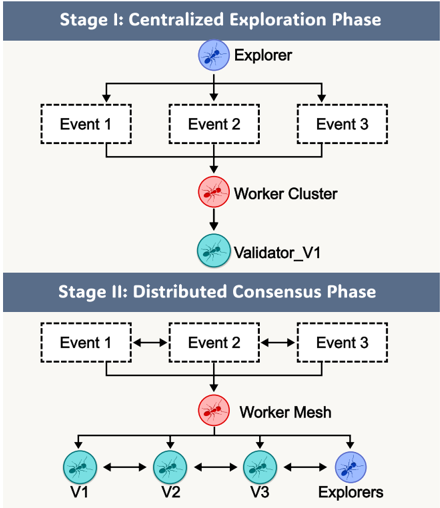
The image is a diagram illustrating a two-stage process: Stage I, a centralized exploration phase, and Stage II, a distributed consensus phase. The diagram uses ant-like figures to represent different roles or agents within the system, such as Explorers, Workers, and Validators. The diagram shows the flow of information and interaction between these agents and events.
### Components/Axes
* **Stage I: Centralized Exploration Phase** (Top Section):
* **Explorer:** Represented by a blue ant-like figure. Located at the top of the stage.
* **Events:** Three events labeled "Event 1", "Event 2", and "Event 3". Represented by dashed rectangles.
* **Worker Cluster:** Represented by a red ant-like figure. Located below the events.
* **Validator_V1:** Represented by a teal ant-like figure. Located below the Worker Cluster.
* **Stage II: Distributed Consensus Phase** (Bottom Section):
* **Events:** Three events labeled "Event 1", "Event 2", and "Event 3". Represented by dashed rectangles.
* **Worker Mesh:** Represented by a red ant-like figure. Located below the events.
* **V1, V2, V3, Explorers:** Represented by teal ant-like figures. Located below the Worker Mesh.
### Detailed Analysis
* **Stage I: Centralized Exploration Phase**
* The "Explorer" (blue ant) is connected to "Event 1", "Event 2", and "Event 3" (dashed rectangles) via downward arrows.
* "Event 1", "Event 2", and "Event 3" are connected to the "Worker Cluster" (red ant) via downward arrows.
* The "Worker Cluster" (red ant) is connected to "Validator_V1" (teal ant) via a downward arrow.
* **Stage II: Distributed Consensus Phase**
* "Event 1", "Event 2", and "Event 3" (dashed rectangles) are interconnected with bidirectional arrows.
* "Event 1", "Event 2", and "Event 3" are connected to the "Worker Mesh" (red ant) via downward arrows.
* The "Worker Mesh" (red ant) is connected to "V1", "V2", "V3", and "Explorers" (teal ants) via downward arrows.
* "V1", "V2", "V3", and "Explorers" are interconnected with bidirectional arrows.
### Key Observations
* The diagram illustrates a transition from a centralized exploration phase to a distributed consensus phase.
* The ant-like figures represent different roles or agents within the system.
* The arrows indicate the flow of information or interaction between the agents and events.
* The dashed rectangles represent events.
* The color of the ant-like figures seems to indicate their role: blue for explorers, red for workers, and teal for validators/participants.
### Interpretation
The diagram depicts a system that first explores events in a centralized manner, where an "Explorer" interacts with multiple "Events," and then transitions to a distributed consensus phase, where multiple entities ("V1," "V2," "V3," and "Explorers") interact with each other and the "Events." The "Worker Cluster" and "Worker Mesh" likely represent processing or coordination units in each phase. The "Validator_V1" in Stage I suggests a validation step after the centralized exploration. The bidirectional arrows in Stage II indicate a collaborative or iterative process for reaching consensus. The diagram suggests a shift from a top-down, centralized approach to a more collaborative, distributed approach.