\n
## Diagram: System Architecture - Centralized Exploration & Distributed Consensus
### Overview
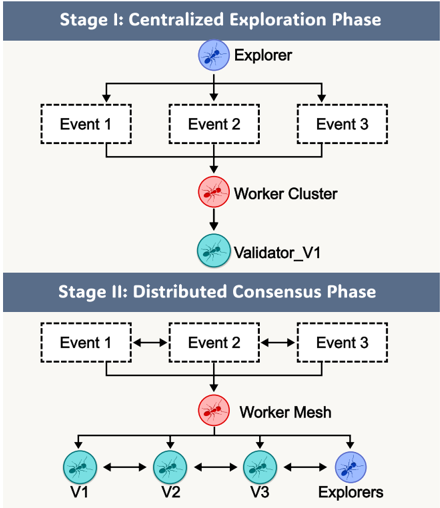
The image depicts a system architecture diagram illustrating two phases: a "Centralized Exploration Phase" (Stage I) and a "Distributed Consensus Phase" (Stage II). The diagram uses a flow chart style with boxes representing components and arrows indicating the direction of data or control flow. The components are represented with icons of ants, and boxes with text labels.
### Components/Axes
The diagram consists of the following components:
* **Explorer:** Represented by a blue ant icon.
* **Worker Cluster:** Represented by a red ant cluster icon.
* **Validator\_V1:** Represented by a blue ant icon.
* **Worker Mesh:** Represented by a red ant cluster icon.
* **V1, V2, V3:** Represented by blue ant icons.
* **Events:** Represented by dashed boxes labeled "Event 1", "Event 2", and "Event 3".
* **Stages:** "Stage I: Centralized Exploration Phase" and "Stage II: Distributed Consensus Phase" are labels for the two sections of the diagram.
The diagram uses arrows to show the flow of information between components.
### Detailed Analysis or Content Details
**Stage I: Centralized Exploration Phase**
* An "Explorer" (blue ant) is at the top.
* The Explorer sends data to three "Events" (Event 1, Event 2, Event 3) in parallel.
* The three Events converge into a "Worker Cluster" (red ant cluster).
* The Worker Cluster then sends data to a "Validator\_V1" (blue ant).
* The flow is unidirectional, from Explorer to Validator.
**Stage II: Distributed Consensus Phase**
* "Event 1", "Event 2", and "Event 3" are present, but now they have bidirectional arrows between them.
* These Events converge into a "Worker Mesh" (red ant cluster).
* The Worker Mesh connects to three "Validators" (V1, V2, V3) and an "Explorer" (blue ant).
* There are bidirectional arrows between the Worker Mesh and each of the Validators (V1, V2, V3) and the Explorer.
* There are also bidirectional arrows between V1, V2, V3 and the Explorer.
### Key Observations
* Stage I is a centralized process, with a single Explorer and a single Validator.
* Stage II is a distributed process, with multiple Validators and an Explorer, and bidirectional communication between components.
* The use of ant icons suggests a swarm intelligence or distributed computing approach.
* The dashed boxes for "Events" indicate that these are intermediate stages or data points in the process.
* The transition from a single "Worker Cluster" to a "Worker Mesh" indicates a shift from centralized processing to distributed processing.
### Interpretation
The diagram illustrates a two-stage system for data processing or decision-making. Stage I represents an exploratory phase where a single agent (Explorer) gathers information about multiple events and a central worker processes it for validation. Stage II represents a consensus-building phase where multiple agents (Validators and Explorer) collaborate to reach a consensus on the events.
The shift from centralized to distributed processing suggests a system designed to handle increasing complexity or scale. The bidirectional communication in Stage II indicates a more iterative and collaborative process, allowing for feedback and refinement of the initial exploration. The use of "Events" suggests that the system is event-driven, responding to changes or occurrences in the environment.
The ant icons likely symbolize a bio-inspired approach to problem-solving, drawing on the collective intelligence and adaptability of ant colonies. This suggests a system that is robust, scalable, and capable of handling uncertainty. The diagram does not provide quantitative data, but it clearly outlines the architectural principles and flow of information within the system.