## Heatmap: Spatial Modes
### Overview
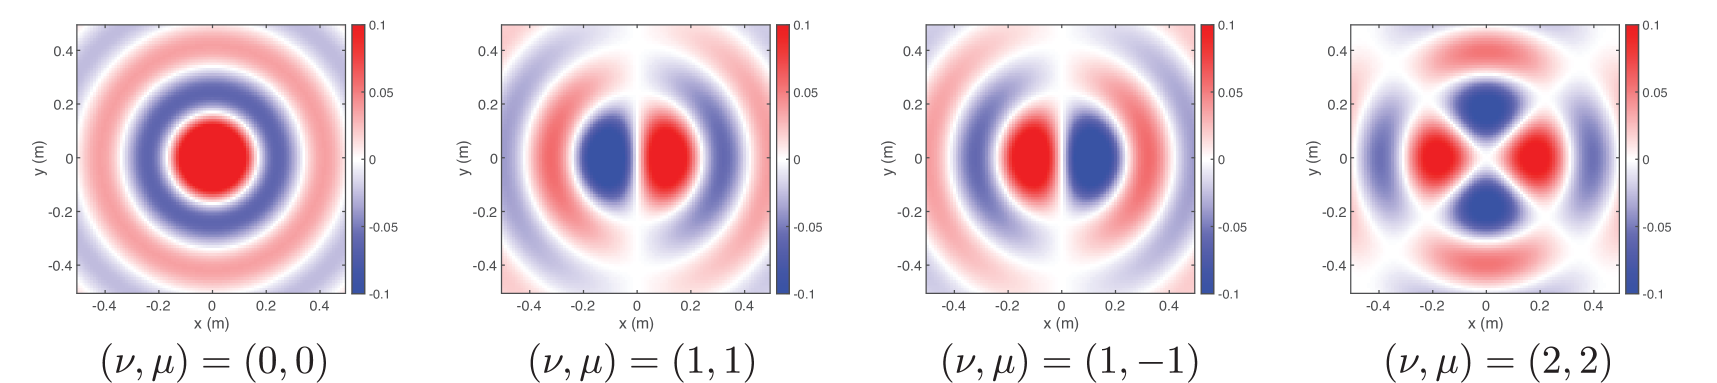
The image presents four heatmaps, each visualizing a different spatial mode. The heatmaps are arranged horizontally, and each one displays a 2D spatial distribution with x and y axes ranging from approximately -0.4 to 0.4 meters. The color scheme represents the amplitude of the mode, with red indicating positive values, blue indicating negative values, and white indicating zero. Each heatmap is labeled with a pair of indices (ν, μ) representing the mode number.
### Components/Axes
* **X-axis:** Represents the x-coordinate in meters, ranging from -0.4 to 0.4.
* **Y-axis:** Represents the y-coordinate in meters, ranging from -0.4 to 0.4.
* **Colorbar:** A vertical colorbar is present to the right of each heatmap, mapping color to amplitude. Red corresponds to approximately 0.1, white corresponds to 0, and blue corresponds to approximately -0.1. Intermediate colors represent values between these extremes.
* **Labels:** Each heatmap is labeled with (ν, μ) values: (0, 0), (1, 1), (1, -1), and (2, 2).
### Detailed Analysis
**Heatmap 1: (ν, μ) = (0, 0)**
* **Trend:** The amplitude is highest at the center and decreases radially outwards.
* **Data Points:**
* Center: Red, indicating a positive value close to 0.1.
* Surrounding area: Alternating rings of white, blue, and red, indicating decreasing and oscillating amplitude.
* Outer edges: Light blue/red, indicating values close to -0.05/0.05.
**Heatmap 2: (ν, μ) = (1, 1)**
* **Trend:** The amplitude is positive on the right side and negative on the left side, with a vertical nodal line at x = 0.
* **Data Points:**
* Right side: Red, indicating a positive value close to 0.1.
* Left side: Blue, indicating a negative value close to -0.1.
* Center: White, indicating a value close to 0.
**Heatmap 3: (ν, μ) = (1, -1)**
* **Trend:** The amplitude is positive on the left side and negative on the right side, with a vertical nodal line at x = 0.
* **Data Points:**
* Left side: Red, indicating a positive value close to 0.1.
* Right side: Blue, indicating a negative value close to -0.1.
* Center: White, indicating a value close to 0.
**Heatmap 4: (ν, μ) = (2, 2)**
* **Trend:** The amplitude has a more complex pattern with four lobes, alternating between positive and negative values.
* **Data Points:**
* Top-left and bottom-right: Red, indicating positive values close to 0.1.
* Top-right and bottom-left: Blue, indicating negative values close to -0.1.
* Center: White, indicating a value close to 0.
### Key Observations
* The (0, 0) mode exhibits radial symmetry.
* The (1, 1) and (1, -1) modes have a single nodal line along the y-axis, with opposite signs on either side.
* The (2, 2) mode has a more complex pattern with four lobes and two nodal lines.
* The colorbar is consistent across all four heatmaps, allowing for direct comparison of amplitude values.
### Interpretation
The heatmaps visualize different spatial modes, likely representing solutions to a wave equation or similar physical system. The indices (ν, μ) likely correspond to quantum numbers or mode numbers that determine the spatial distribution of the amplitude. The (0, 0) mode represents the fundamental mode, while the other modes represent higher-order modes with more complex spatial patterns. The alternating positive and negative regions indicate regions of constructive and destructive interference. The spatial modes could represent, for example, the modes of vibration of a circular membrane or the modes of an electromagnetic field in a cavity. The (1,1) and (1,-1) modes are rotations of each other.