\n
## Heatmaps: Spatial Distribution of a Function
### Overview
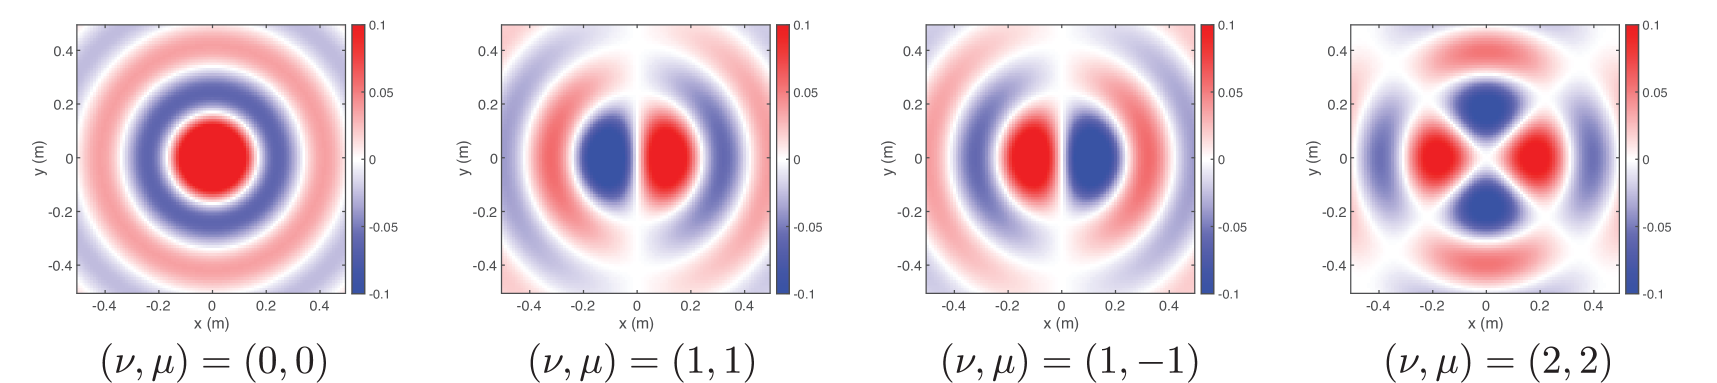
The image presents four heatmaps, arranged horizontally. Each heatmap visualizes a two-dimensional function over a spatial domain defined by x and y coordinates, ranging from -0.4 to 0.4 meters. The color gradient represents the function's value, with red indicating higher values and blue indicating lower values. Each heatmap is labeled with a parameter pair (ν, μ).
### Components/Axes
Each heatmap shares the following components:
* **X-axis:** Labeled "x (m)", ranging from -0.4 to 0.4 with increments of approximately 0.1.
* **Y-axis:** Labeled "y (m)", ranging from -0.4 to 0.4 with increments of approximately 0.1.
* **Colorbar:** Located to the right of each heatmap, ranging from -0.1 to 0.1. The colorbar indicates the function's value corresponding to each color.
* **Labels:** Below each heatmap, the parameter pair (ν, μ) is specified.
### Detailed Analysis or Content Details
**Heatmap 1: (ν, μ) = (0, 0)**
* The heatmap displays a circular pattern.
* The center of the circle is at approximately (0, 0).
* The function values are highest (red) at the center and decrease radially outwards.
* There are alternating rings of positive (red) and negative (blue) values.
* Maximum value: approximately 0.1
* Minimum value: approximately -0.1
**Heatmap 2: (ν, μ) = (1, 1)**
* The heatmap displays a circular pattern, but the center is shifted.
* The center of the circle is at approximately (0.2, 0.2).
* The function values are highest (red) at the center and decrease radially outwards.
* There are alternating rings of positive (red) and negative (blue) values.
* Maximum value: approximately 0.1
* Minimum value: approximately -0.1
**Heatmap 3: (ν, μ) = (1, -1)**
* The heatmap displays a circular pattern, but the center is shifted.
* The center of the circle is at approximately (-0.2, 0.2).
* The function values are highest (red) at the center and decrease radially outwards.
* There are alternating rings of positive (red) and negative (blue) values.
* Maximum value: approximately 0.1
* Minimum value: approximately -0.1
**Heatmap 4: (ν, μ) = (2, 2)**
* The heatmap displays a circular pattern, but the center is shifted.
* The center of the circle is at approximately (0.2, -0.2).
* The function values are highest (red) at the center and decrease radially outwards.
* There are alternating rings of positive (red) and negative (blue) values.
* Maximum value: approximately 0.1
* Minimum value: approximately -0.1
### Key Observations
* All four heatmaps exhibit a circular pattern with alternating rings of positive and negative values.
* The parameter pair (ν, μ) determines the center of the circular pattern.
* The function values range consistently between approximately -0.1 and 0.1 across all heatmaps.
* The colorbar scale is identical for all four heatmaps.
### Interpretation
The data suggests that the heatmaps represent the spatial distribution of a function that exhibits circular symmetry. The parameters ν and μ control the center of this circular distribution. The alternating rings of positive and negative values indicate an oscillatory behavior within the circular pattern, potentially representing interference or wave-like phenomena. The consistent range of function values across all heatmaps suggests that the amplitude of the oscillation is constant, while the parameters ν and μ only affect the spatial location of the pattern. This could represent a wave function or a similar mathematical construct where the parameters define the phase or position of the wave. The function appears to be radially symmetric around the center defined by (ν, μ).