## Heatmap Array: Parameter-Dependent Distribution Patterns
### Overview
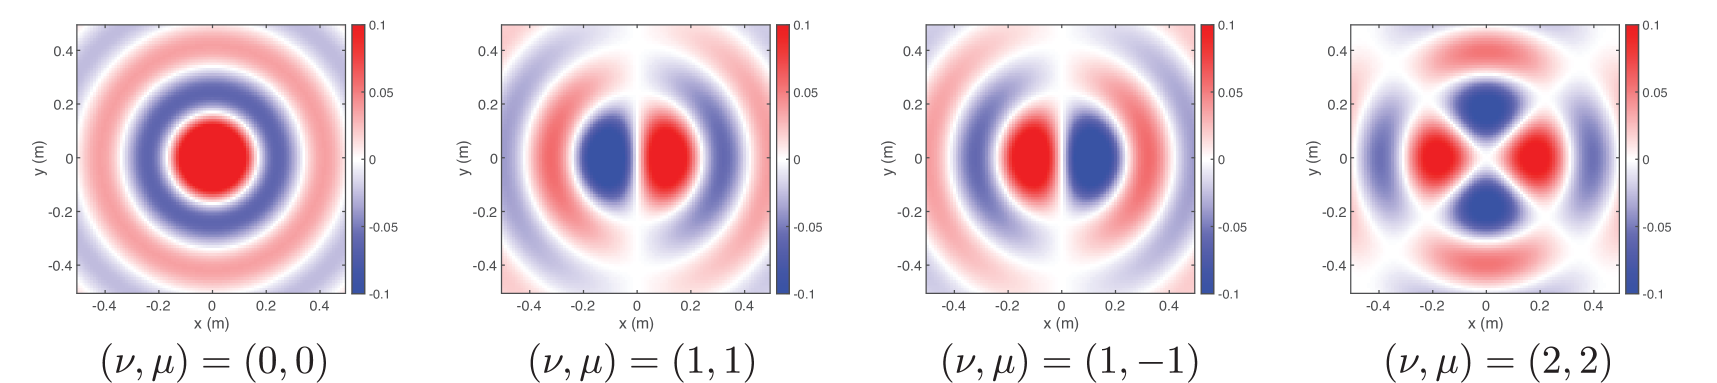
The image displays four heatmaps arranged horizontally, each representing a distinct parameter configuration (ν, μ) with spatial distributions visualized through color gradients. All panels share identical axis scales (-0.4 to 0.4 m) and a central color bar ranging from -0.1 (blue) to +0.1 (red). The patterns evolve systematically with parameter changes, suggesting a mathematical relationship between (ν, μ) and spatial distribution characteristics.
### Components/Axes
- **X-axis**: Labeled "x (m)" with ticks at -0.4, -0.2, 0, 0.2, 0.4
- **Y-axis**: Labeled "y (m)" with identical tick spacing
- **Color Bar**: Vertical gradient from blue (-0.1) to red (+0.1) positioned right of all panels
- **Panel Labels**:
- Panel 1: (ν, μ) = (0, 0)
- Panel 2: (ν, μ) = (1, 1)
- Panel 3: (ν, μ) = (1, -1)
- Panel 4: (ν, μ) = (2, 2)
### Detailed Analysis
1. **(0, 0) Panel**:
- Central red core (peak value ~+0.1) surrounded by concentric alternating red/blue rings
- Symmetric radial distribution with 4-fold rotational symmetry
- Color transitions occur at approximately ±0.1m, ±0.2m, ±0.3m from center
2. **(1, 1) Panel**:
- Vertical dichotomy: left half blue (-0.05 to 0), right half red (0 to +0.05)
- Central white band (0 value) at x=0
- Radial symmetry preserved but with axial polarization
3. **(1, -1) Panel**:
- Horizontal dichotomy: upper half red, lower half blue
- Central white band at y=0
- Mirrors (1,1) pattern with orthogonal polarization
4. **(2, 2) Panel**:
- Four-quadrant pattern: red in diagonal quadrants, blue in anti-diagonal
- Central white cross (x=0 and y=0)
- Increased angular resolution with 8-fold symmetry
### Key Observations
- Parameter magnitude correlates with angular resolution: higher |ν|/|μ| values produce more segmented patterns
- Sign combinations (ν/μ positive/negative) determine polarization axis (vertical/horizontal)
- All patterns maintain radial symmetry about origin despite parameter variations
- Color intensity maxima/minima consistently reach ±0.1 across all configurations
### Interpretation
The heatmaps demonstrate a parameterized spatial modulation system where:
- ν controls horizontal modulation frequency
- μ controls vertical modulation frequency
- Sign combinations dictate polarization orientation
- Magnitude values determine modulation depth
This suggests a mathematical model where the distribution function f(x,y) = g(νx, μy) with g being a sinusoidal or similar periodic function. The (2,2) configuration's cross pattern indicates a second-harmonic spatial modulation, while the (1,1)/(1,-1) pair shows fundamental mode polarization effects. The consistent color bar range implies normalized output values despite parameter changes.