## Table: Classification of Causal Models
### Overview
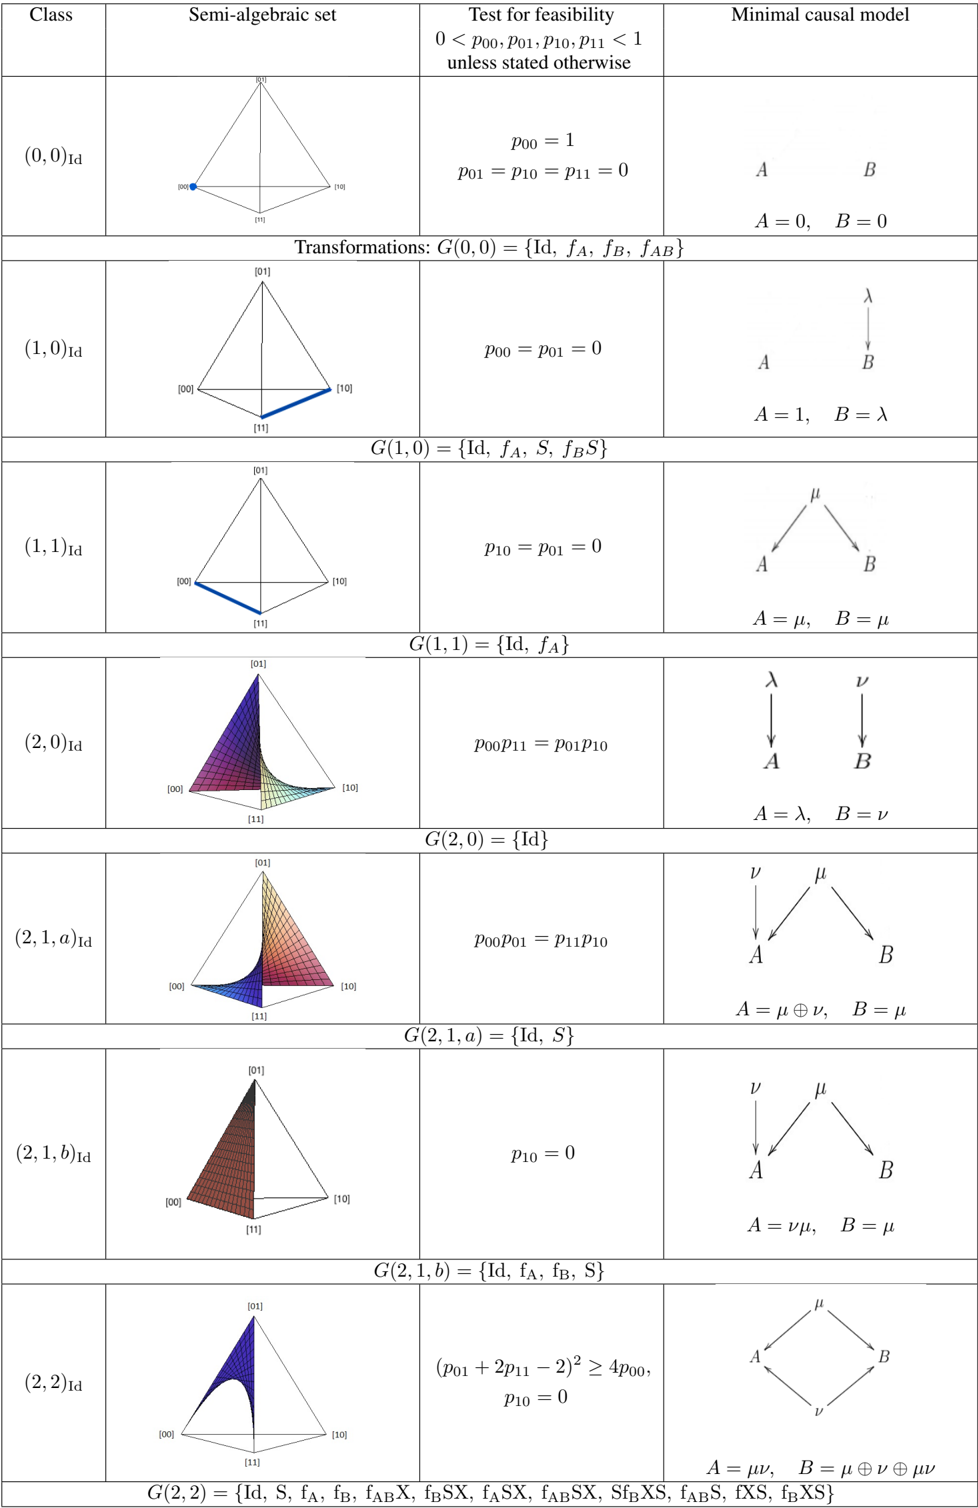
The image presents a table that classifies different causal models based on their semi-algebraic sets, feasibility tests, and minimal causal representations. The table is organized into rows, each representing a different class of causal model, and columns that describe the properties of each class.
### Components/Axes
The table has the following columns:
1. **Class**: Identifies the class of the causal model using a tuple notation (e.g., (0,0)Id, (1,0)Id, etc.).
2. **Semi-algebraic set**: Visual representation of the semi-algebraic set associated with the class. These are depicted as tetrahedrons with different regions highlighted.
3. **Test for feasibility**: Mathematical conditions that must be satisfied for the model to be feasible. These conditions involve probabilities *p00*, *p01*, *p10*, and *p11*. The general condition is "0 < *p00*, *p01*, *p10*, *p11* < 1 unless stated otherwise."
4. **Minimal causal model**: A diagram representing the minimal causal structure of the model, along with equations defining the relationships between variables A and B.
* Transformations: G(x, y) = {set of transformations}
### Detailed Analysis or ### Content Details
Here's a breakdown of each row in the table:
**Row 1: (0,0)Id**
* **Class**: (0,0)Id
* **Semi-algebraic set**: A tetrahedron with a single point highlighted in blue. The vertices of the tetrahedron are labeled \[00], \[01], \[10], and \[11].
* **Test for feasibility**:
* *p00* = 1
* *p01* = *p10* = *p11* = 0
* **Minimal causal model**:
* Diagram: Two independent nodes, A and B.
* Equations: A = 0, B = 0
* Transformations: G(0, 0) = {Id, fA, fB, fAB}
**Row 2: (1,0)Id**
* **Class**: (1,0)Id
* **Semi-algebraic set**: A tetrahedron with one edge highlighted in blue, connecting vertices \[10] and \[11]. The vertices of the tetrahedron are labeled \[00], \[01], \[10], and \[11].
* **Test for feasibility**:
* *p00* = *p01* = 0
* **Minimal causal model**:
* Diagram: A -> B, with a lambda symbol (λ) pointing from A to B.
* Equations: A = 1, B = λ
* Transformations: G(1,0) = {Id, fA, S, fBS}
**Row 3: (1,1)Id**
* **Class**: (1,1)Id
* **Semi-algebraic set**: A tetrahedron with one edge highlighted in blue, connecting vertices \[00] and \[11]. The vertices of the tetrahedron are labeled \[00], \[01], \[10], and \[11].
* **Test for feasibility**:
* *p10* = *p01* = 0
* **Minimal causal model**:
* Diagram: μ -> A, μ -> B, with a mu symbol (μ) pointing to both A and B.
* Equations: A = μ, B = μ
* Transformations: G(1,1) = {Id, fA}
**Row 4: (2,0)Id**
* **Class**: (2,0)Id
* **Semi-algebraic set**: A curved surface within a tetrahedron. The vertices of the tetrahedron are labeled \[00], \[01], \[10], and \[11].
* **Test for feasibility**:
* *p00* *p11* = *p01* *p10*
* **Minimal causal model**:
* Diagram: λ -> A, ν -> B, with a lambda symbol (λ) pointing to A and a nu symbol (ν) pointing to B.
* Equations: A = λ, B = ν
* Transformations: G(2,0) = {Id}
**Row 5: (2,1,a)Id**
* **Class**: (2,1,a)Id
* **Semi-algebraic set**: A curved surface within a tetrahedron. The vertices of the tetrahedron are labeled \[00], \[01], \[10], and \[11].
* **Test for feasibility**:
* *p00* *p01* = *p11* *p10*
* **Minimal causal model**:
* Diagram: ν -> A, μ -> B, with a nu symbol (ν) pointing to A and a mu symbol (μ) pointing to B.
* Equations: A = μ ⊕ ν, B = μ
* Transformations: G(2, 1, a) = {Id, S}
**Row 6: (2,1,b)Id**
* **Class**: (2,1,b)Id
* **Semi-algebraic set**: A tetrahedron with half of the volume shaded. The vertices of the tetrahedron are labeled \[00], \[01], \[10], and \[11].
* **Test for feasibility**:
* *p10* = 0
* **Minimal causal model**:
* Diagram: ν -> A, μ -> B, with a nu symbol (ν) pointing to A and a mu symbol (μ) pointing to B.
* Equations: A = νμ, B = μ
* Transformations: G(2,1,b) = {Id, fA, fB, S}
**Row 7: (2,2)Id**
* **Class**: (2,2)Id
* **Semi-algebraic set**: A curved surface within a tetrahedron. The vertices of the tetrahedron are labeled \[00], \[01], \[10], and \[11].
* **Test for feasibility**:
* (*p01* + 2*p11* - 2)^2 ≥ 4*p00*
* *p10* = 0
* **Minimal causal model**:
* Diagram: μ -> A, μ -> B, ν -> A, ν -> B, with a mu symbol (μ) and a nu symbol (ν) pointing to both A and B.
* Equations: A = μν, B = μ ⊕ ν ⊕ μν
* Transformations: G(2, 2) = {Id, S, fA, fB, fABX, fBSX, fASx, fABSX, SfBXS, fABS, fXS, fBXS}
### Key Observations
* The "Class" column seems to categorize models based on some underlying properties, possibly related to the complexity or structure of the causal relationships.
* The "Semi-algebraic set" column provides a visual representation of the feasible parameter space for each model.
* The "Test for feasibility" column gives precise mathematical conditions that determine whether a given set of probabilities is consistent with the model.
* The "Minimal causal model" column shows the simplest causal structure that can generate the observed data, along with equations that describe the relationships between the variables.
### Interpretation
The table provides a classification of different causal models, linking their mathematical properties (feasibility tests) with their structural representations (causal diagrams). The semi-algebraic sets offer a geometric interpretation of the model's constraints. The transformations listed for each class likely represent the set of interventions or manipulations that leave the causal structure invariant. The table is useful for understanding the relationships between different types of causal models and for determining which model is most appropriate for a given dataset.