## Line Chart: Mean Pass Rate vs. Mean Number of Tokens Generated
### Overview
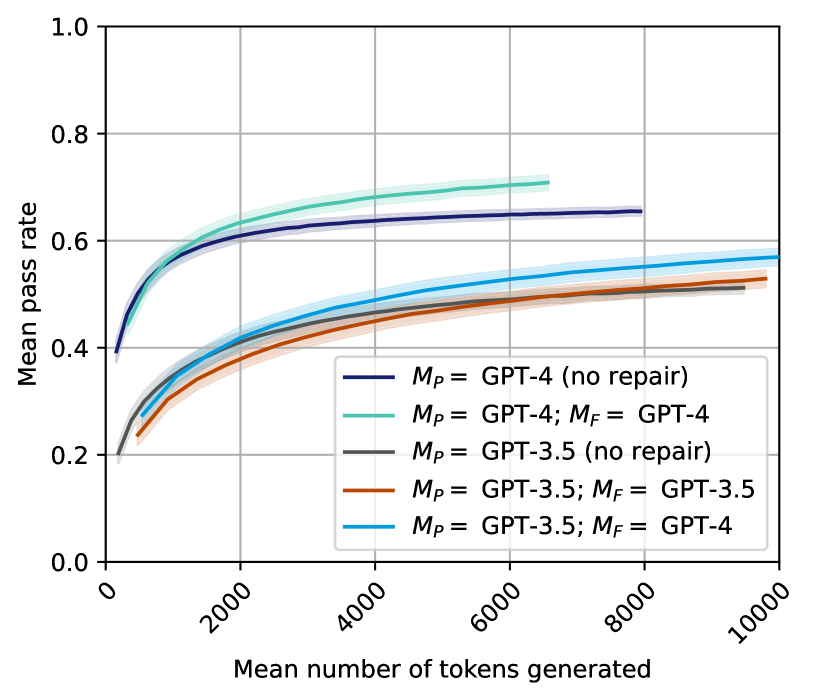
The image is a line chart comparing the mean pass rate against the mean number of tokens generated for different GPT models and repair configurations. The chart displays five data series, each representing a different model configuration, with shaded regions indicating uncertainty.
### Components/Axes
* **X-axis:** Mean number of tokens generated, ranging from 0 to 10000, with tick marks at intervals of 2000.
* **Y-axis:** Mean pass rate, ranging from 0.0 to 1.0, with tick marks at intervals of 0.2.
* **Legend (located in the center-right of the chart):**
* Dark Blue: *M<sub>P</sub>* = GPT-4 (no repair)
* Light Green: *M<sub>P</sub>* = GPT-4; *M<sub>F</sub>* = GPT-4
* Gray: *M<sub>P</sub>* = GPT-3.5 (no repair)
* Brown: *M<sub>P</sub>* = GPT-3.5; *M<sub>F</sub>* = GPT-3.5
* Teal: *M<sub>P</sub>* = GPT-3.5; *M<sub>F</sub>* = GPT-4
### Detailed Analysis
* **Dark Blue Line: *M<sub>P</sub>* = GPT-4 (no repair)**
* Trend: The line slopes upward, starting at approximately 0.4 and reaching approximately 0.65, then plateaus.
* Data Points:
* At 0 tokens, the mean pass rate is approximately 0.4.
* At 2000 tokens, the mean pass rate is approximately 0.6.
* At 6000 tokens, the mean pass rate is approximately 0.65.
* At 10000 tokens, the mean pass rate is approximately 0.65.
* **Light Green Line: *M<sub>P</sub>* = GPT-4; *M<sub>F</sub>* = GPT-4**
* Trend: The line slopes upward, starting at approximately 0.25 and reaching approximately 0.7, then plateaus.
* Data Points:
* At 0 tokens, the mean pass rate is approximately 0.25.
* At 2000 tokens, the mean pass rate is approximately 0.62.
* At 6000 tokens, the mean pass rate is approximately 0.7.
* **Gray Line: *M<sub>P</sub>* = GPT-3.5 (no repair)**
* Trend: The line slopes upward, starting at approximately 0.2 and reaching approximately 0.52, then plateaus.
* Data Points:
* At 0 tokens, the mean pass rate is approximately 0.2.
* At 2000 tokens, the mean pass rate is approximately 0.4.
* At 6000 tokens, the mean pass rate is approximately 0.5.
* At 10000 tokens, the mean pass rate is approximately 0.52.
* **Brown Line: *M<sub>P</sub>* = GPT-3.5; *M<sub>F</sub>* = GPT-3.5**
* Trend: The line slopes upward, starting at approximately 0.25 and reaching approximately 0.5, then plateaus.
* Data Points:
* At 0 tokens, the mean pass rate is approximately 0.25.
* At 2000 tokens, the mean pass rate is approximately 0.38.
* At 6000 tokens, the mean pass rate is approximately 0.48.
* At 10000 tokens, the mean pass rate is approximately 0.5.
* **Teal Line: *M<sub>P</sub>* = GPT-3.5; *M<sub>F</sub>* = GPT-4**
* Trend: The line slopes upward, starting at approximately 0.28 and reaching approximately 0.57, then plateaus.
* Data Points:
* At 0 tokens, the mean pass rate is approximately 0.28.
* At 2000 tokens, the mean pass rate is approximately 0.45.
* At 6000 tokens, the mean pass rate is approximately 0.55.
* At 10000 tokens, the mean pass rate is approximately 0.57.
### Key Observations
* GPT-4 models generally outperform GPT-3.5 models.
* The "no repair" GPT-4 model has a higher initial pass rate but plateaus earlier than the GPT-4 model with repair.
* Using GPT-4 for repair (*M<sub>F</sub>*) on GPT-3.5 (*M<sub>P</sub>*) improves the pass rate compared to using GPT-3.5 for both.
* All models show diminishing returns in pass rate as the number of tokens generated increases.
### Interpretation
The chart illustrates the relationship between the number of tokens generated and the mean pass rate for different GPT models and repair configurations. The data suggests that using a more advanced model (GPT-4) generally leads to a higher pass rate. Furthermore, the use of a repair mechanism (indicated by *M<sub>F</sub>*) can improve the performance of the models, especially in the initial stages of token generation. The plateauing of the pass rates indicates that there is a limit to the improvement that can be achieved by simply generating more tokens. The shaded regions around the lines represent the uncertainty in the measurements, which should be considered when interpreting the results.