\n
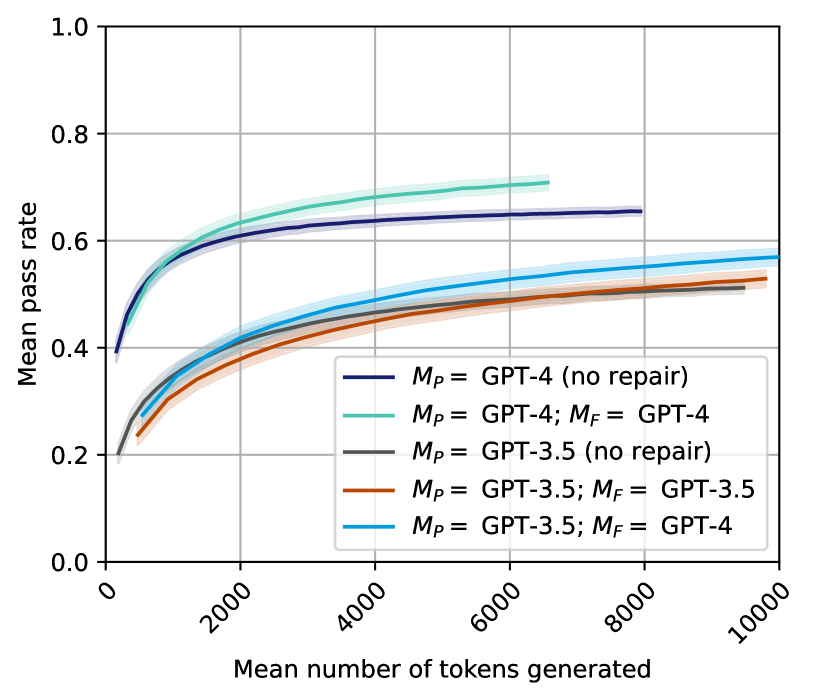
## Line Chart: Pass Rate vs. Tokens Generated for Different Models
### Overview
This line chart depicts the relationship between the mean number of tokens generated and the mean pass rate for several configurations of GPT models (GPT-4 and GPT-3.5) with and without a "repair" step (denoted as *M<sub>P</sub>* and *M<sub>F</sub>*). The chart aims to demonstrate how the performance (pass rate) of these models changes as they generate more text.
### Components/Axes
* **X-axis:** "Mean number of tokens generated". Scale ranges from 0 to 10000, with tick marks at 0, 2000, 4000, 6000, 8000, and 10000.
* **Y-axis:** "Mean pass rate". Scale ranges from 0.0 to 1.0, with tick marks at 0.0, 0.2, 0.4, 0.6, 0.8, and 1.0.
* **Legend:** Located in the top-right corner of the chart. Contains the following entries:
* Black line: *M<sub>P</sub>* = GPT-4 (no repair)
* Light blue line: *M<sub>P</sub>* = GPT-4; *M<sub>F</sub>* = GPT-4
* Gray line: *M<sub>P</sub>* = GPT-3.5 (no repair)
* Orange line: *M<sub>P</sub>* = GPT-3.5; *M<sub>F</sub>* = GPT-3.5
* Teal line: *M<sub>P</sub>* = GPT-3.5; *M<sub>F</sub>* = GPT-4
### Detailed Analysis
The chart displays five distinct lines, each representing a different model configuration.
* **GPT-4 (no repair):** (Black line) Starts at approximately 0.15 pass rate at 0 tokens, and increases rapidly to approximately 0.6 pass rate at 2000 tokens. The line then plateaus, reaching approximately 0.63 pass rate at 10000 tokens.
* **GPT-4; GPT-4:** (Light blue line) Starts at approximately 0.2 pass rate at 0 tokens, and increases steadily to approximately 0.58 pass rate at 2000 tokens. It continues to increase, reaching approximately 0.6 pass rate at 10000 tokens.
* **GPT-3.5 (no repair):** (Gray line) Starts at approximately 0.1 pass rate at 0 tokens, and increases to approximately 0.45 pass rate at 2000 tokens. The line then plateaus, reaching approximately 0.48 pass rate at 10000 tokens.
* **GPT-3.5; GPT-3.5:** (Orange line) Starts at approximately 0.1 pass rate at 0 tokens, and increases to approximately 0.5 pass rate at 2000 tokens. It continues to increase, reaching approximately 0.53 pass rate at 10000 tokens.
* **GPT-3.5; GPT-4:** (Teal line) Starts at approximately 0.15 pass rate at 0 tokens, and increases to approximately 0.5 pass rate at 2000 tokens. It continues to increase, reaching approximately 0.55 pass rate at 10000 tokens.
All lines exhibit an initial steep increase in pass rate as the number of tokens generated increases, followed by a flattening of the curve as the number of tokens grows larger.
### Key Observations
* GPT-4 consistently outperforms GPT-3.5 across all configurations, as indicated by its higher pass rates.
* The "no repair" configurations for both GPT-4 and GPT-3.5 have lower initial pass rates compared to configurations with a repair step.
* The repair step (*M<sub>F</sub>*) appears to improve the pass rate, particularly at lower token counts.
* Using GPT-4 for the repair step (*M<sub>F</sub>* = GPT-4) with GPT-3.5 as the initial model (*M<sub>P</sub>* = GPT-3.5) results in a pass rate that is higher than using GPT-3.5 for both steps.
### Interpretation
The data suggests that GPT-4 is a more capable model than GPT-3.5 in terms of generating text that "passes" a certain criteria (the nature of which is not specified in the chart). The "repair" step, represented by *M<sub>F</sub>*, seems to be a valuable addition to the process, improving the quality of the generated text. The combination of GPT-3.5 for initial generation and GPT-4 for repair is a particularly effective strategy, demonstrating that leveraging the strengths of different models can lead to improved performance. The flattening of the curves at higher token counts indicates that there is a limit to the improvement that can be achieved by simply generating more text. The initial steep increase suggests that the models are quickly learning to generate text that meets the pass criteria, but further gains become more difficult as the models approach their maximum performance. The *M<sub>P</sub>* and *M<sub>F</sub>* notation likely refers to a two-stage process where *M<sub>P</sub>* is the primary model generating the text, and *M<sub>F</sub>* is a secondary model used to "repair" or refine the output.