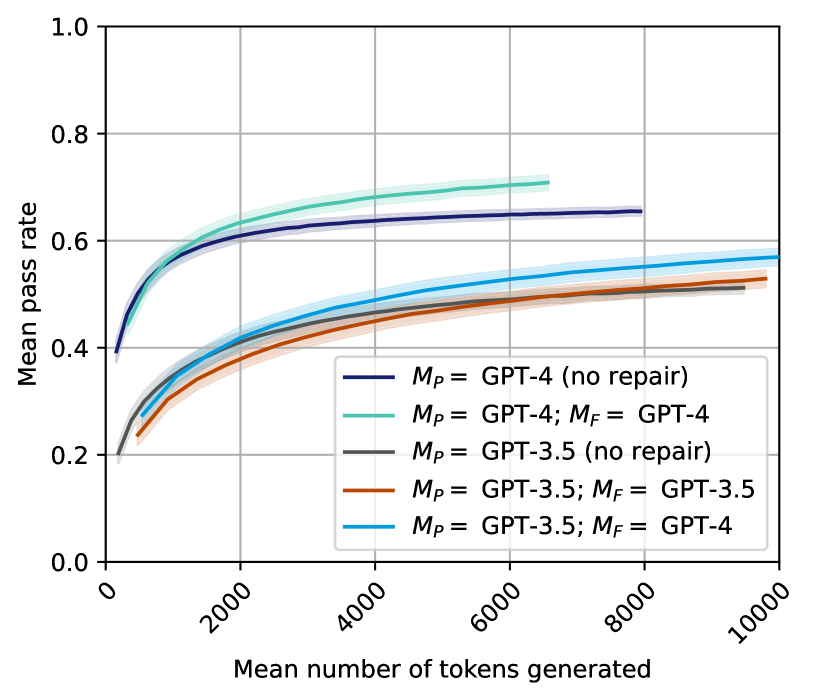
## Line Chart: Mean Pass Rate vs. Mean Number of Tokens Generated
### Overview
The image is a line chart comparing the performance of different Large Language Model (LLM) configurations. It plots the "Mean pass rate" (y-axis) against the "Mean number of tokens generated" (x-axis). The chart shows five distinct data series, each representing a different model setup, with shaded regions likely indicating confidence intervals or standard deviation around the mean.
### Components/Axes
* **Chart Type:** Line chart with shaded error bands.
* **X-Axis:**
* **Label:** "Mean number of tokens generated"
* **Scale:** Linear, ranging from 0 to 10,000.
* **Major Tick Marks:** 0, 2000, 4000, 6000, 8000, 10000.
* **Y-Axis:**
* **Label:** "Mean pass rate"
* **Scale:** Linear, ranging from 0.0 to 1.0.
* **Major Tick Marks:** 0.0, 0.2, 0.4, 0.6, 0.8, 1.0.
* **Legend:** Located in the bottom-right quadrant of the chart area. It contains five entries, each with a colored line sample and a text label.
1. **Dark Blue Line:** `M_P = GPT-4 (no repair)`
2. **Teal/Green Line:** `M_P = GPT-4; M_F = GPT-4`
3. **Gray Line:** `M_P = GPT-3.5 (no repair)`
4. **Orange/Red Line:** `M_P = GPT-3.5; M_F = GPT-3.5`
5. **Light Blue Line:** `M_P = GPT-3.5; M_F = GPT-4`
* **Notation:** `M_P` likely denotes the primary model, and `M_F` denotes a secondary model used for "repair" or refinement.
### Detailed Analysis
**Trend Verification & Data Point Extraction:**
All five lines exhibit a similar logarithmic growth trend: a steep initial increase in pass rate as token count rises from 0, followed by a gradual plateau. The lines are ordered vertically, indicating clear performance tiers.
1. **`M_P = GPT-4; M_F = GPT-4` (Teal/Green Line):**
* **Trend:** Highest-performing series. Slopes upward sharply and maintains the highest position throughout.
* **Approximate Values:** Starts near 0.4 at ~0 tokens. Reaches ~0.6 at 2000 tokens, ~0.68 at 4000 tokens, and plateaus near 0.71 by 6000-7000 tokens (the line ends before 8000).
2. **`M_P = GPT-4 (no repair)` (Dark Blue Line):**
* **Trend:** Second-highest series. Follows a path very close to but consistently below the teal line.
* **Approximate Values:** Starts near 0.4. Reaches ~0.6 at 2000 tokens, ~0.64 at 4000 tokens, and plateaus near 0.66 by 8000 tokens.
3. **`M_P = GPT-3.5; M_F = GPT-4` (Light Blue Line):**
* **Trend:** Middle series. Shows a more gradual ascent compared to the GPT-4 lines.
* **Approximate Values:** Starts near 0.2. Reaches ~0.4 at 2000 tokens, ~0.48 at 4000 tokens, ~0.54 at 6000 tokens, and ~0.57 at 10000 tokens.
4. **`M_P = GPT-3.5; M_F = GPT-3.5` (Orange/Red Line):**
* **Trend:** Fourth series, closely tracking the light blue line but slightly below it.
* **Approximate Values:** Starts near 0.2. Reaches ~0.38 at 2000 tokens, ~0.45 at 4000 tokens, ~0.50 at 6000 tokens, and ~0.53 at 10000 tokens.
5. **`M_P = GPT-3.5 (no repair)` (Gray Line):**
* **Trend:** Lowest-performing series. Follows a path very close to but consistently below the orange line.
* **Approximate Values:** Starts near 0.2. Reaches ~0.37 at 2000 tokens, ~0.44 at 4000 tokens, ~0.49 at 6000 tokens, and ~0.51 at 10000 tokens.
### Key Observations
1. **Clear Performance Hierarchy:** There is a significant and consistent gap between the two GPT-4 based models (top two lines) and the three GPT-3.5 based models (bottom three lines). The GPT-4 models achieve a mean pass rate approximately 0.15-0.20 points higher than their GPT-3.5 counterparts at equivalent token counts.
2. **Impact of Repair (`M_F`):** For both GPT-4 and GPT-3.5, adding a repair model (`M_F`) improves performance over the "no repair" baseline. The teal line (GPT-4 repair) is above the dark blue line (GPT-4 no repair). The light blue and orange lines (GPT-3.5 with repair) are above the gray line (GPT-3.5 no repair).
3. **Cross-Model Repair Benefit:** The most notable observation is that using GPT-4 as a repair model for GPT-3.5 (`M_P = GPT-3.5; M_F = GPT-4`, light blue line) yields better performance than using GPT-3.5 to repair itself (orange line). This suggests a stronger repair model can elevate the performance of a weaker primary model.
4. **Diminishing Returns:** All curves show strong diminishing returns. The majority of the pass rate gain occurs within the first 2000-4000 tokens generated. Beyond 6000 tokens, the curves flatten considerably.
### Interpretation
This chart demonstrates the relationship between computational effort (measured in generated tokens) and task success rate (pass rate) for different LLM agent configurations. The data suggests several key insights:
* **Model Capability is Primary:** The base capability of the primary model (`M_P`) is the strongest determinant of performance. GPT-4 fundamentally outperforms GPT-3.5, regardless of the repair strategy.
* **Repair Mechanisms are Effective:** Implementing a repair or refinement step (`M_F`) consistently improves outcomes. This supports the architectural pattern of using a secondary model to critique and improve the output of a primary model.
* **Asymmetric Repair is Powerful:** The benefit is not symmetric. A more capable model (GPT-4) serves as a more effective repair agent for a less capable model (GPT-3.5) than the less capable model does for itself. This implies that in a multi-model system, assigning the most capable model to the "critic" or "repair" role can be a highly efficient strategy.
* **Efficiency Plateau:** There is a clear point of diminishing returns. Investing tokens beyond approximately 6000 yields minimal improvement in pass rate for these tasks. This has practical implications for cost and latency optimization in deployed systems, suggesting that capping token generation could be beneficial without significant performance loss.
The chart effectively argues for the value of both using advanced base models and implementing multi-model repair architectures, with a particular emphasis on the strategic advantage of using a strong model in the repair role.