## Line Graph: Mean Pass Rate
### Overview
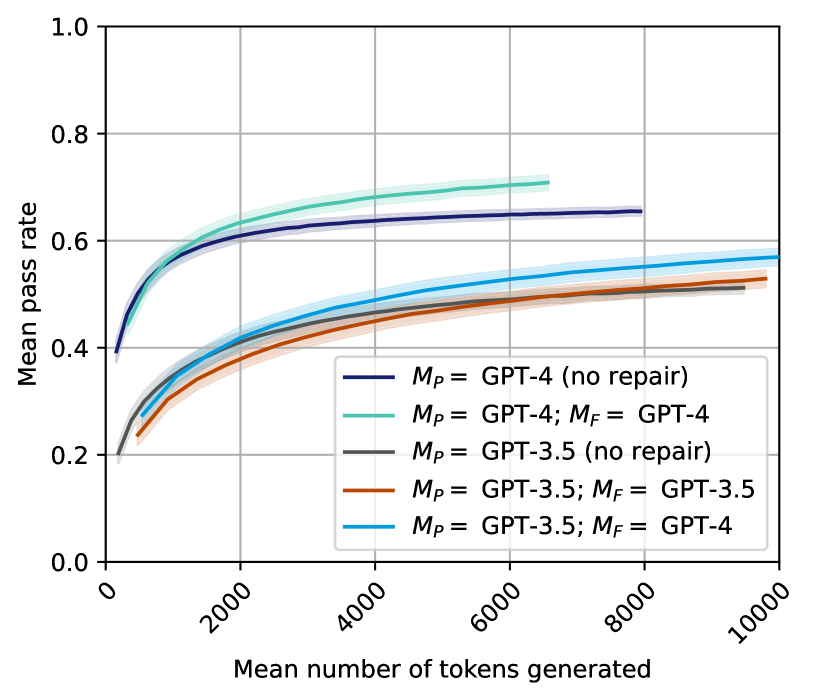
The line graph depicts the mean pass rate of different versions of GPT models as a function of the mean number of tokens generated. The graph compares the performance of GPT-4, GPT-3.5, and their repaired versions.
### Components/Axes
- **X-axis**: Mean number of tokens generated
- **Y-axis**: Mean pass rate
- **Legend**: Differentiates between GPT-4 (no repair), GPT-4 (repaired), GPT-3.5 (no repair), and GPT-3.5 (repaired)
### Detailed Analysis or ### Content Details
- **GPT-4 (no repair)**: The line is the lowest, indicating the lowest mean pass rate across all token counts.
- **GPT-4 (repaired)**: The line is the highest, showing the highest mean pass rate.
- **GPT-3.5 (no repair)**: The line is slightly above GPT-4 (no repair), indicating a higher pass rate than GPT-4 but lower than GPT-4 (repaired).
- **GPT-3.5 (repaired)**: The line is the second highest, showing a significant improvement in pass rate compared to GPT-3.5 (no repair).
### Key Observations
- The repaired versions of GPT-4 and GPT-3.5 show a significant improvement in mean pass rate.
- The difference in pass rate between the repaired and non-repaired versions is most pronounced at higher token counts.
- There is a general trend of increasing pass rate with the increase in token count for all models.
### Interpretation
The data suggests that the repair of GPT models significantly improves their performance in terms of mean pass rate. This is particularly noticeable in the repaired versions of GPT-4 and GPT-3.5, which outperform their non-repaired counterparts across all token counts. The improvement is most pronounced at higher token counts, indicating that the repair might be more effective in handling more complex or longer text. The trend of increasing pass rate with token count suggests that the models become more proficient in generating accurate responses as the input text length increases.