## Line Chart: Mean Pass Rate vs. Mean Number of Tokens Generated
### Overview
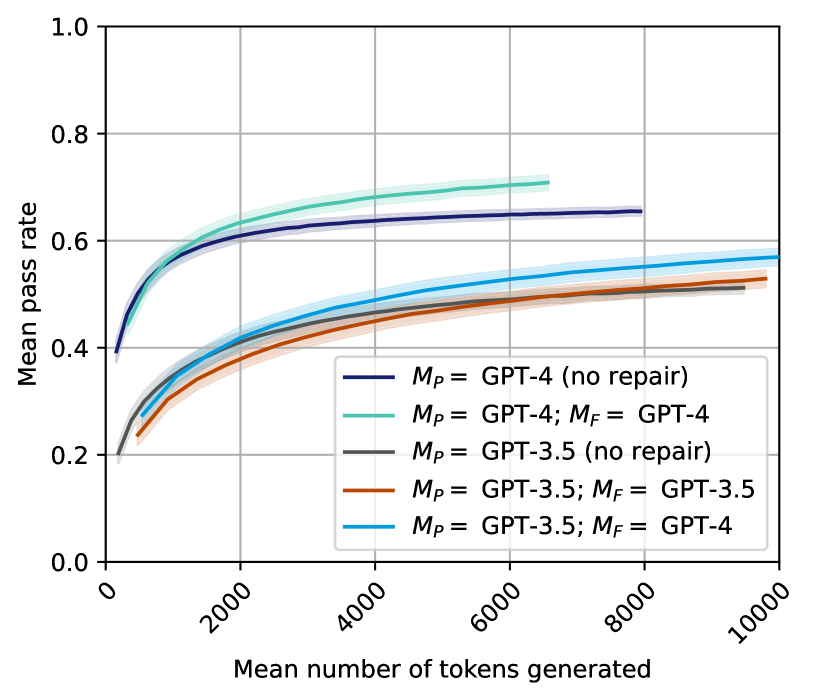
The chart illustrates the relationship between the mean number of tokens generated and the mean pass rate for different configurations of GPT models. Five distinct data series are plotted, each representing a unique combination of primary (M_P) and repair (M_F) models. The y-axis represents the mean pass rate (0.0–1.0), while the x-axis shows the mean number of tokens generated (0–10,000).
### Components/Axes
- **X-axis**: "Mean number of tokens generated" (0–10,000, linear scale).
- **Y-axis**: "Mean pass rate" (0.0–1.0, linear scale).
- **Legend**: Located in the bottom-right corner, with five entries:
1. **Dark blue**: M_P = GPT-4 (no repair)
2. **Teal**: M_P = GPT-4; M_F = GPT-4
3. **Gray**: M_P = GPT-3.5 (no repair)
4. **Orange**: M_P = GPT-3.5; M_F = GPT-3.5
5. **Light blue**: M_P = GPT-3.5; M_F = GPT-4
### Detailed Analysis
1. **Dark blue (M_P = GPT-4, no repair)**:
- Starts at ~0.4 at 2,000 tokens.
- Rises sharply to ~0.65 at 6,000 tokens.
- Plateaus at ~0.65 beyond 6,000 tokens.
- **Trend**: Steady increase followed by stabilization.
2. **Teal (M_P = GPT-4; M_F = GPT-4)**:
- Begins at ~0.5 at 2,000 tokens.
- Peaks at ~0.7 at 6,000 tokens.
- Drops to ~0.55 at 8,000 tokens.
- **Trend**: Initial improvement, followed by a decline.
3. **Gray (M_P = GPT-3.5, no repair)**:
- Starts at ~0.3 at 2,000 tokens.
- Gradually increases to ~0.55 at 8,000 tokens.
- **Trend**: Slow, linear growth.
4. **Orange (M_P = GPT-3.5; M_F = GPT-3.5)**:
- Begins at ~0.3 at 2,000 tokens.
- Rises to ~0.5 at 8,000 tokens.
- **Trend**: Moderate, linear increase.
5. **Light blue (M_P = GPT-3.5; M_F = GPT-4)**:
- Starts at ~0.35 at 2,000 tokens.
- Reaches ~0.55 at 10,000 tokens.
- **Trend**: Steady, linear improvement.
### Key Observations
- **GPT-4 superiority**: Configurations using GPT-4 (dark blue, teal) consistently outperform GPT-3.5 variants.
- **Repair mechanism impact**:
- For GPT-4, the repair model (M_F = GPT-4) initially improves performance but later causes a decline (teal line).
- For GPT-3.5, pairing with GPT-4 as M_F (light blue) significantly boosts pass rates compared to GPT-3.5 alone (orange line).
- **Threshold effects**: The teal line’s drop after 6,000 tokens suggests potential overfitting or diminishing returns when both models are GPT-4.
### Interpretation
The data demonstrates that GPT-4 models achieve higher pass rates across all token ranges. However, the repair mechanism’s effectiveness depends on the primary model:
- **GPT-4**: Using GPT-4 as both M_P and M_F yields peak performance but risks overfitting, as seen in the teal line’s decline.
- **GPT-3.5**: Pairing with GPT-4 as M_F (light blue) maximizes performance, highlighting the value of hybrid configurations. The gray and orange lines (GPT-3.5 variants) show that standalone GPT-3.5 models underperform compared to GPT-4.
Notably, the teal line’s post-6,000-token drop warrants further investigation—it may indicate a flaw in the repair process when both models are identical high-capacity systems. This suggests that repair mechanisms might need to be tailored to the primary model’s capabilities to avoid unintended consequences.