\n
## Diagram: Collaborative Optimization Process
### Overview
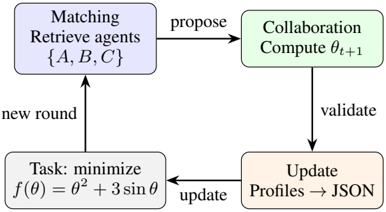
The image depicts a cyclical diagram illustrating a collaborative optimization process involving agents and a task to minimize a function. The diagram shows four main stages connected by arrows indicating the flow of information and control.
### Components/Axes
The diagram consists of four rectangular blocks, each representing a stage in the process. These are:
1. **Matching:** Retrieve agents {A, B, C}
2. **Collaboration:** Compute θ<sub>t+1</sub>
3. **Update:** Profiles → JSON
4. **Task:** minimize f(θ) = θ<sup>2</sup> + 3 sin θ
Arrows connect these blocks, labeled with actions: "propose", "validate", "update", and "new round".
### Detailed Analysis or Content Details
The diagram represents a closed-loop process.
* **Matching Block (Top-Left):** This block retrieves agents labeled A, B, and C. The output of this block is a "propose" signal to the Collaboration block.
* **Collaboration Block (Top-Right):** This block computes the next value of θ (theta), denoted as θ<sub>t+1</sub>. The subscript 't' likely represents a time step or iteration number. The output of this block is a "validate" signal to the Update block.
* **Update Block (Bottom-Right):** This block updates agent profiles and converts them to JSON format. The output of this block is an "update" signal to the Task block.
* **Task Block (Bottom-Left):** This block defines the optimization task: minimizing the function f(θ) = θ<sup>2</sup> + 3 sin θ. The output of this block is a "new round" signal to the Matching block, completing the cycle.
The arrows indicate the direction of information flow:
* Matching -> Collaboration (labeled "propose")
* Collaboration -> Update (labeled "validate")
* Update -> Task (labeled "update")
* Task -> Matching (labeled "new round")
### Key Observations
The diagram illustrates a feedback loop where agents collaborate to minimize a function. The use of JSON suggests a data exchange format for agent profiles. The function f(θ) = θ<sup>2</sup> + 3 sin θ is a standard mathematical function that can have multiple local minima, making the optimization task potentially challenging.
### Interpretation
This diagram represents a distributed optimization algorithm. The agents (A, B, C) likely collaborate to find the minimum of the function f(θ). The "Matching" block could be responsible for assigning agents to specific sub-problems or coordinating their efforts. The "Collaboration" block represents the core optimization step where agents exchange information and update their estimates of θ. The "Update" block manages agent profiles and ensures data consistency. The "Task" block defines the objective function and initiates a new iteration of the optimization process. The use of JSON suggests a modern, data-driven approach to agent management and communication. The cyclical nature of the diagram indicates an iterative process that continues until a satisfactory solution is found. The function itself suggests a non-trivial optimization problem, potentially requiring sophisticated algorithms to converge to a global minimum.