## Chart: Mean Squared Error (MSE) for Experienced Bidders
### Overview
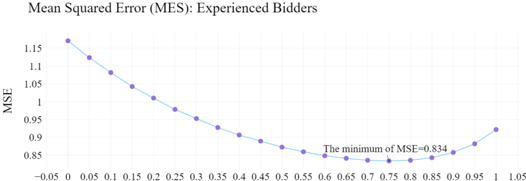
The image is a line chart showing the Mean Squared Error (MSE) for experienced bidders. The x-axis represents an unspecified variable ranging from -0.05 to 1.05, while the y-axis represents the MSE, ranging from 0.85 to 1.15. The chart illustrates how the MSE changes with respect to the x-axis variable. The line shows a decreasing trend initially, reaching a minimum, and then increasing.
### Components/Axes
* **Title:** Mean Squared Error (MES): Experienced Bidders
* **X-axis:** Ranges from -0.05 to 1.05, with increments of 0.05.
* **Y-axis:** Labeled "MSE", ranges from 0.85 to 1.15, with increments of 0.05.
* **Data Series:** A single blue line representing the MSE.
* **Annotation:** "The minimum of MSE=0.834" is written near the lowest point of the curve.
### Detailed Analysis
The blue line represents the MSE values.
* **Trend:** The MSE initially decreases as the x-axis value increases, reaching a minimum around x=0.7, and then increases as the x-axis value continues to increase.
* **Data Points (Approximate):**
* x = -0.05, MSE ≈ 1.16
* x = 0, MSE ≈ 1.13
* x = 0.05, MSE ≈ 1.09
* x = 0.1, MSE ≈ 1.08
* x = 0.15, MSE ≈ 1.04
* x = 0.2, MSE ≈ 1.01
* x = 0.25, MSE ≈ 0.98
* x = 0.3, MSE ≈ 0.96
* x = 0.35, MSE ≈ 0.94
* x = 0.4, MSE ≈ 0.92
* x = 0.45, MSE ≈ 0.90
* x = 0.5, MSE ≈ 0.88
* x = 0.55, MSE ≈ 0.86
* x = 0.6, MSE ≈ 0.85
* x = 0.65, MSE ≈ 0.84
* x = 0.7, MSE ≈ 0.835 (minimum)
* x = 0.75, MSE ≈ 0.84
* x = 0.8, MSE ≈ 0.84
* x = 0.85, MSE ≈ 0.84
* x = 0.9, MSE ≈ 0.85
* x = 0.95, MSE ≈ 0.88
* x = 1, MSE ≈ 0.92
* x = 1.05, MSE ≈ 0.93
### Key Observations
* The MSE reaches a minimum value of approximately 0.834 around x = 0.7.
* The MSE decreases sharply from x = -0.05 to x = 0.3, then decreases more gradually until it reaches its minimum.
* After reaching the minimum, the MSE increases gradually from x = 0.7 to x = 1.05.
### Interpretation
The chart suggests that there is an optimal value for the x-axis variable (around 0.7) that minimizes the Mean Squared Error for experienced bidders. This implies that experienced bidders perform best when this variable is set to this optimal value. The initial decrease in MSE indicates that as the variable increases from -0.05, the bidders' performance improves. After the optimal value, further increases in the variable lead to a decline in performance, as indicated by the increasing MSE. The annotation confirms the minimum MSE value is 0.834.