## Line Chart: Mean Squared Error (MSE) for Experienced Bidders
### Overview
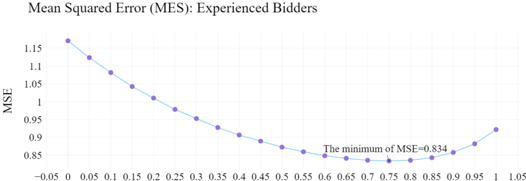
The image displays a line chart plotting Mean Squared Error (MSE) against an unlabeled independent variable (x-axis) for a group identified as "Experienced Bidders." The chart shows a clear, smooth curve with a single minimum point.
### Components/Axes
* **Title:** "Mean Squared Error (MES): Experienced Bidders" (Note: The title contains a likely typo, using "MES" while the y-axis is labeled "MSE").
* **Y-Axis:**
* **Label:** "MSE"
* **Scale:** Linear, ranging from 0.85 to 1.15.
* **Major Tick Marks:** 0.85, 0.9, 0.95, 1, 1.05, 1.1, 1.15.
* **X-Axis:**
* **Label:** None provided. The variable is represented numerically.
* **Scale:** Linear, ranging from -0.05 to 1.05.
* **Major Tick Marks:** Every 0.05 units, from -0.05 to 1.05.
* **Data Series:**
* **Representation:** A single, continuous purple line with circular markers at each data point.
* **Legend/Annotation:** A text annotation placed near the curve's minimum states: "The minimum of MSE=0.834". This serves as the key data point highlight.
* **Spatial Layout:** The chart area is bounded by the axes. The annotation is positioned in the lower-right quadrant of the plot area, just above the minimum point of the curve.
### Detailed Analysis
**Trend Verification:** The purple line exhibits a clear convex (U-shaped) trend. It slopes downward from left to right, reaches a minimum, and then slopes upward.
**Data Point Extraction (Approximate Values):**
The following table lists the approximate MSE values for each marked x-coordinate, read from the chart. Values are approximate due to visual interpolation.
| X-Coordinate | Approximate MSE | Notes |
| :--- | :--- | :--- |
| 0.00 | 1.15 | Starting point, highest MSE. |
| 0.05 | 1.12 | |
| 0.10 | 1.09 | |
| 0.15 | 1.06 | |
| 0.20 | 1.03 | |
| 0.25 | 1.00 | |
| 0.30 | 0.97 | |
| 0.35 | 0.95 | |
| 0.40 | 0.93 | |
| 0.45 | 0.91 | |
| 0.50 | 0.89 | |
| 0.55 | 0.87 | |
| 0.60 | 0.86 | |
| 0.65 | 0.85 | |
| **0.70** | **0.834** | **Explicitly labeled minimum point.** |
| 0.75 | 0.84 | |
| 0.80 | 0.85 | |
| 0.85 | 0.86 | |
| 0.90 | 0.88 | |
| 0.95 | 0.90 | |
| 1.00 | 0.93 | End of plotted data. |
### Key Observations
1. **Clear Minimum:** The MSE achieves a distinct, labeled minimum value of **0.834** at **x = 0.7**.
2. **Symmetry:** The curve is roughly symmetric around the minimum point (x=0.7). The MSE at x=0.4 (~0.93) is similar to the MSE at x=1.0 (~0.93).
3. **Monotonic Segments:** The function is strictly decreasing on the interval [0.0, 0.7] and strictly increasing on the interval [0.7, 1.0].
4. **Rate of Change:** The slope is steepest at the extremes (near x=0 and x=1) and flattens as it approaches the minimum, characteristic of a quadratic or similar convex function.
### Interpretation
The chart demonstrates a classic optimization scenario for "Experienced Bidders." The unlabeled x-axis likely represents a tunable parameter, strategy intensity, or bid adjustment factor. The data suggests:
* **Optimal Point:** There exists an optimal value for this parameter (x=0.7) that minimizes prediction error (MSE). Deviating from this point in either direction—being too conservative (lower x) or too aggressive (higher x)—results in worse performance.
* **Performance Sensitivity:** The bidders' error is highly sensitive to this parameter. Moving from the optimal x=0.7 to x=0.0 increases the MSE by approximately 38% (from 0.834 to ~1.15).
* **Predictable Behavior:** The smooth, convex curve indicates a predictable, non-chaotic relationship between the parameter and error. This allows for reliable calibration to find the minimum.
* **Contextual Implication:** For experienced bidders, this model quantifies the cost of sub-optimal strategy selection. The "sweet spot" at x=0.7 represents the most accurate or efficient bidding behavior according to this MSE metric. The chart provides a clear visual argument for targeting that specific parameter value.