## Diagram: LLM Fact-Checking Flow
### Overview
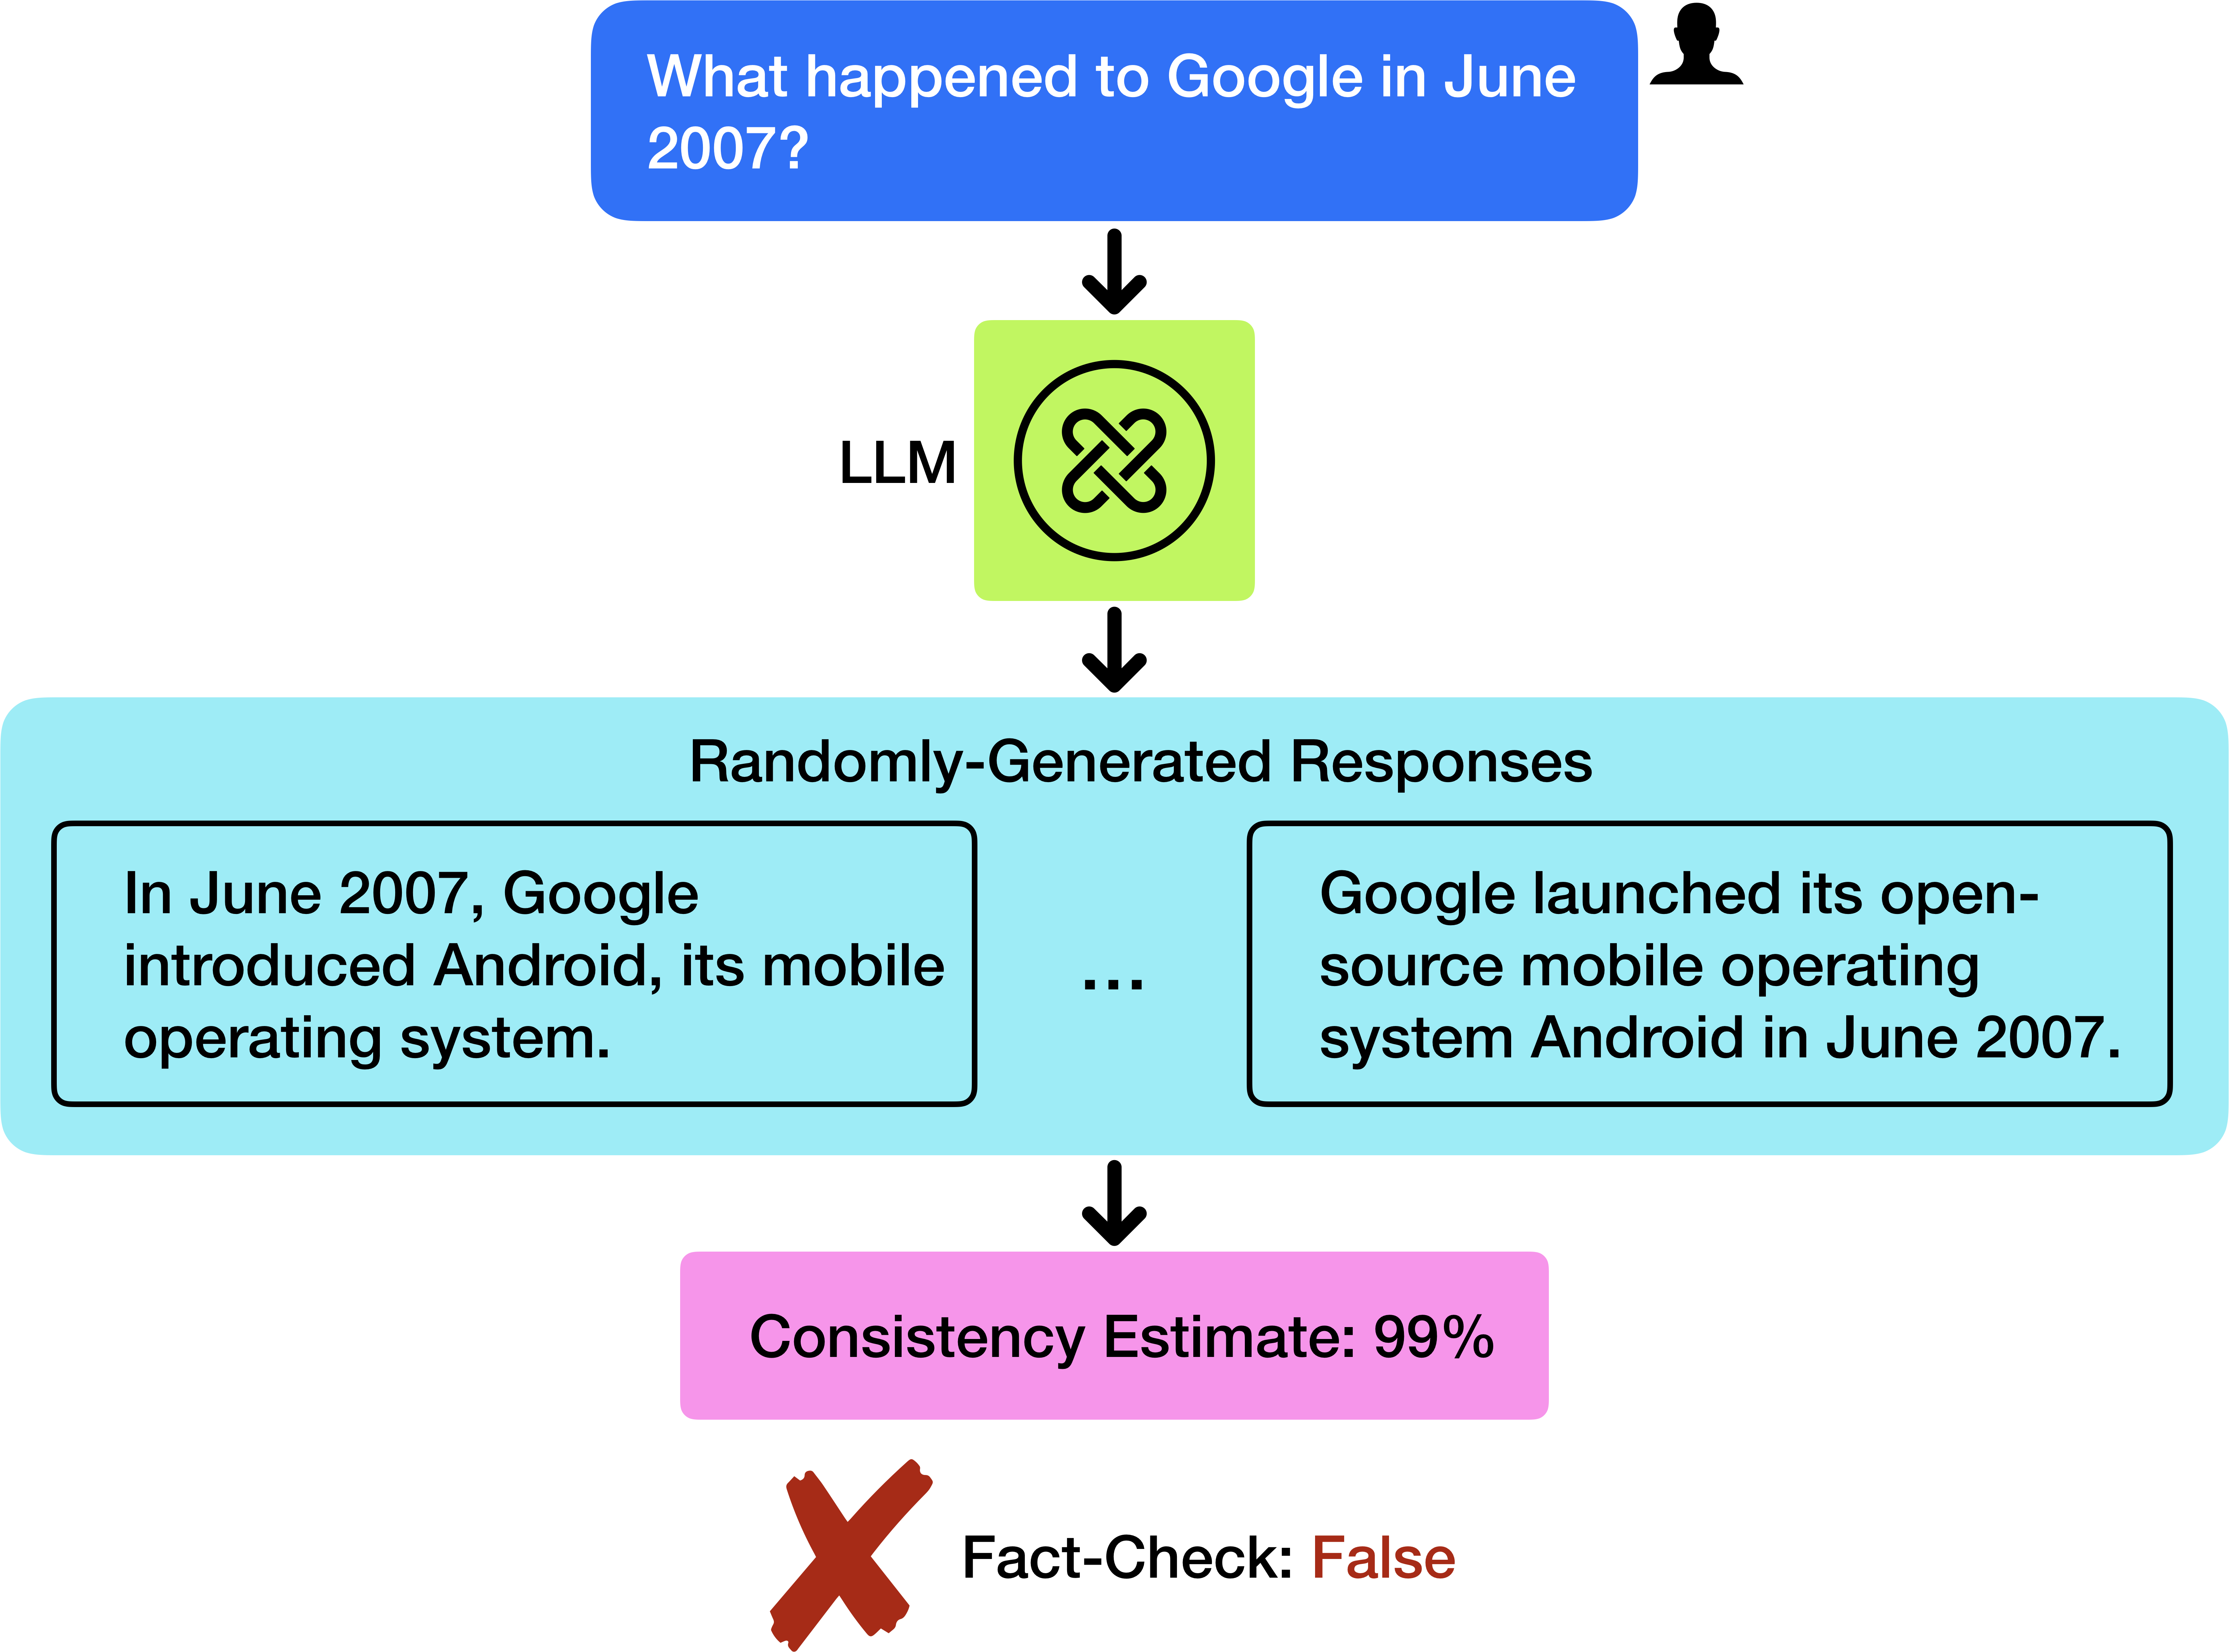
The image is a diagram illustrating the process of fact-checking the response of a Large Language Model (LLM) to a specific question. The diagram shows the flow from the initial question to the LLM, the generated responses, a consistency estimate, and the final fact-check result.
### Components/Axes
* **Top:** Blue rounded rectangle containing the question: "What happened to Google in June 2007?" A silhouette of a person's head is present to the right of the question.
* **Arrow 1:** A downward-pointing arrow connects the question to the LLM.
* **LLM:** A light green square labeled "LLM" with a knot-like symbol inside.
* **Arrow 2:** A downward-pointing arrow connects the LLM to the randomly-generated responses.
* **Randomly-Generated Responses:** A light blue rounded rectangle labeled "Randomly-Generated Responses" containing two example responses:
* "In June 2007, Google introduced Android, its mobile operating system."
* "Google launched its open-source mobile operating system Android in June 2007."
* An ellipsis "..." is present between the two responses.
* **Arrow 3:** A downward-pointing arrow connects the randomly-generated responses to the consistency estimate.
* **Consistency Estimate:** A pink rounded rectangle labeled "Consistency Estimate: 99%".
* **Arrow 4:** A downward-pointing arrow connects the consistency estimate to the fact-check result.
* **Fact-Check:** A red "X" symbol and the text "Fact-Check: False".
### Detailed Analysis
The diagram depicts a sequence of steps:
1. A question is posed: "What happened to Google in June 2007?".
2. The question is fed to an LLM.
3. The LLM generates multiple responses. Two example responses are provided, both stating that Google introduced or launched Android in June 2007.
4. A consistency estimate is calculated, resulting in 99%.
5. A fact-check is performed, and the result is "False".
### Key Observations
* The LLM provides consistent responses (99% consistency).
* Despite the high consistency, the fact-check indicates that the responses are false.
### Interpretation
The diagram illustrates a scenario where an LLM can generate consistent but incorrect information. The high consistency estimate suggests that the LLM is confident in its answer, but the fact-check reveals that the information is inaccurate. This highlights the importance of fact-checking LLM outputs, even when the model exhibits high consistency in its responses. The diagram suggests that consistency alone is not a reliable indicator of accuracy.