# Technical Document Extraction: LLM Hallucination and Consistency Diagram
## 1. Document Overview
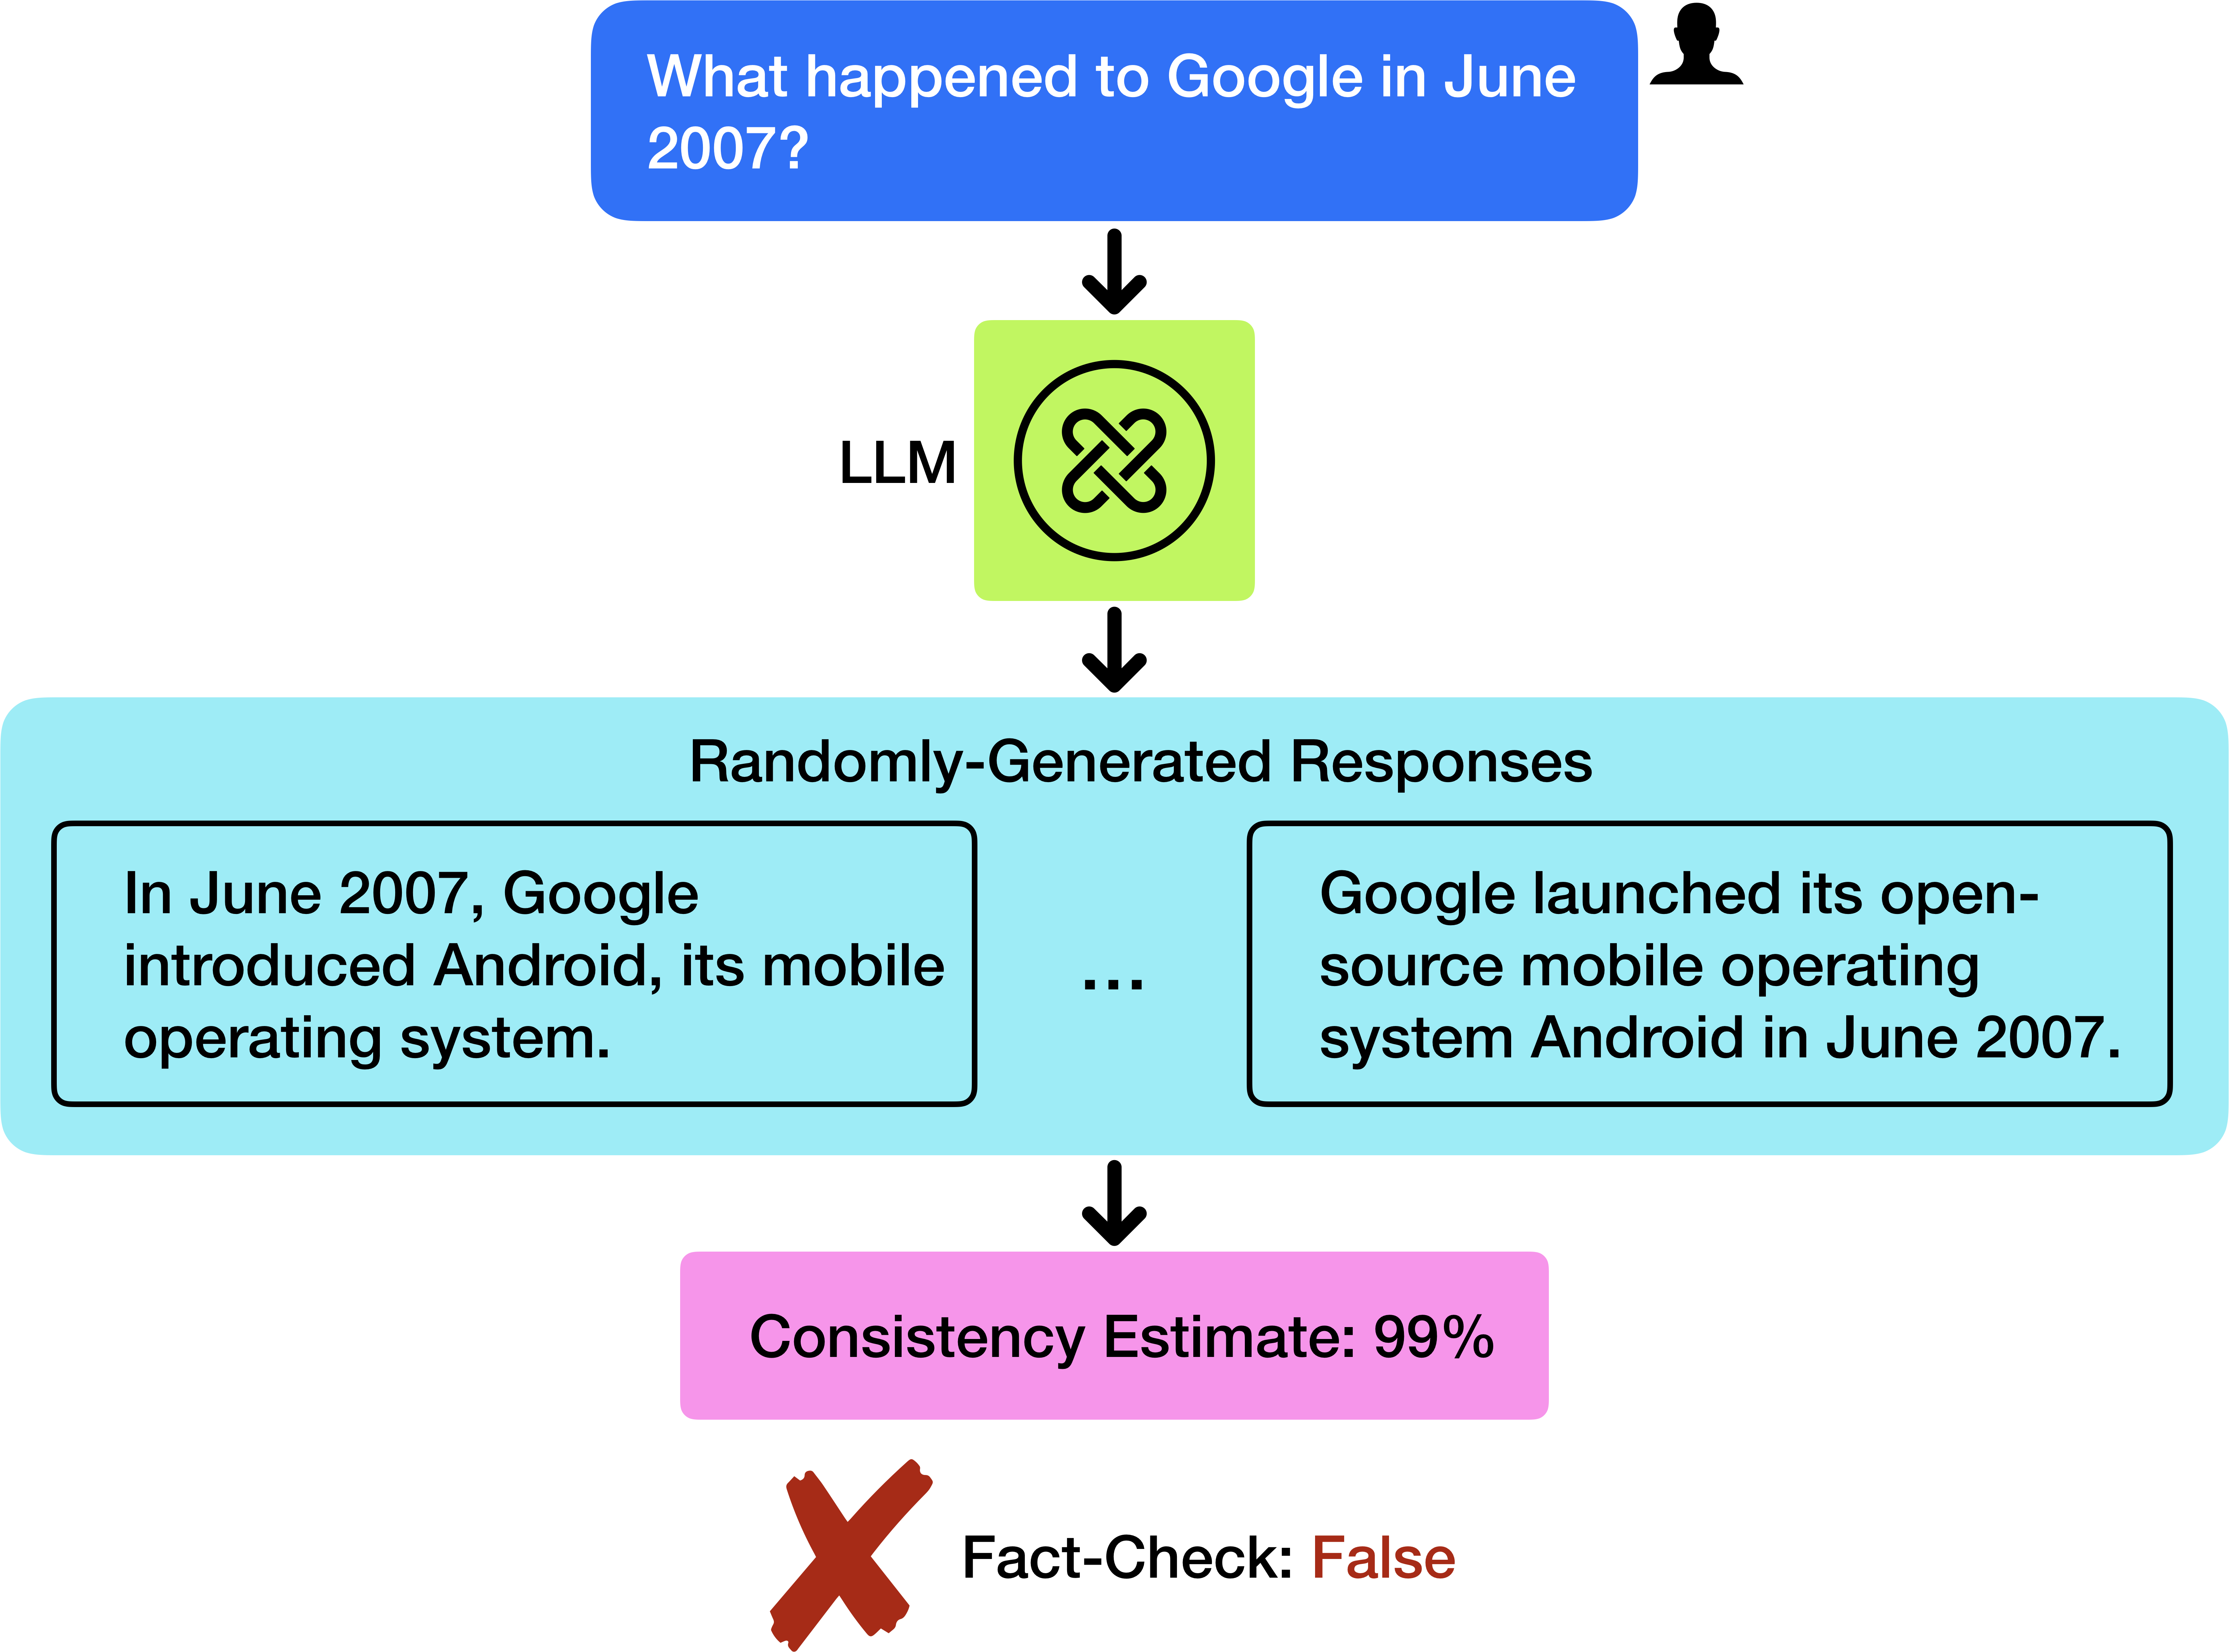
This image is a flow diagram illustrating a technical concept in Artificial Intelligence, specifically regarding Large Language Models (LLMs). It demonstrates a scenario where a model provides highly consistent but factually incorrect information (a "hallucination").
## 2. Component Isolation and Flow Analysis
The diagram follows a vertical top-to-bottom linear flow, segmented into four primary stages:
### Stage 1: Input (Header)
* **Visual Element:** A blue rounded rectangular box with a black silhouette icon of a person's head and shoulders in the top right corner.
* **Transcribed Text:** "What happened to Google in June 2007?"
* **Function:** Represents the user query or prompt being fed into the system.
### Stage 2: Processing (The Model)
* **Visual Element:** A lime green square box containing a black circular icon with an interlocking "X" or knot-like symbol.
* **Label:** To the left of the box, the text "LLM" is present.
* **Function:** Represents the Large Language Model processing the input.
### Stage 3: Output Generation (Main Content)
* **Visual Element:** A large light-cyan rounded rectangular container labeled "Randomly-Generated Responses". Inside this container are two smaller white boxes with black borders, separated by an ellipsis (...).
* **Left Response Box Text:** "In June 2007, Google introduced Android, its mobile operating system."
* **Right Response Box Text:** "Google launched its open-source mobile operating system Android in June 2007."
* **Function:** Shows that the model generated multiple variations of the same claim.
### Stage 4: Evaluation (Footer)
* **Visual Element 1:** A pink rounded rectangular box.
* **Transcribed Text:** "Consistency Estimate: 99%"
* **Visual Element 2:** A large brown "X" mark followed by text.
* **Transcribed Text:** "Fact-Check: False"
* **Function:** This stage highlights the discrepancy between internal model confidence (consistency) and external truth (factuality).
## 3. Logic and Trend Verification
* **Flow Direction:** Indicated by four downward-pointing black arrows connecting each stage.
* **Trend Analysis:** The diagram illustrates a "High Consistency, Low Accuracy" failure mode.
* The LLM generates multiple responses that are semantically identical (both claim Android launched in June 2007).
* Because the responses match, the "Consistency Estimate" is nearly perfect (99%).
* However, the final "Fact-Check" reveals the information is "False" (Android was actually announced in November 2007).
## 4. Summary of Textual Data
| Component | Text Content |
| :--- | :--- |
| **User Prompt** | What happened to Google in June 2007? |
| **Processor** | LLM |
| **Process Type** | Randomly-Generated Responses |
| **Response A** | In June 2007, Google introduced Android, its mobile operating system. |
| **Response B** | Google launched its open-source mobile operating system Android in June 2007. |
| **Metric** | Consistency Estimate: 99% |
| **Verification** | Fact-Check: False |
## 5. Language Declaration
The primary and only language present in this image is **English**. No other languages were detected.