## Diagram: Simple Network Flow
### Overview
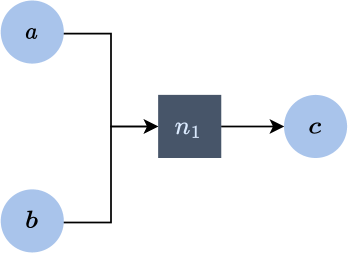
The image is a simple diagram illustrating a network flow. It consists of two input nodes (a and b), a processing node (n1), and an output node (c). Arrows indicate the direction of flow.
### Components/Axes
* **Nodes:**
* `a`: A circular node, light blue in color, located in the top-left.
* `b`: A circular node, light blue in color, located in the bottom-left.
* `c`: A circular node, light blue in color, located on the right side.
* `n1`: A square node, dark gray in color, located in the center.
* **Edges:**
* Two edges connect nodes `a` and `b` to node `n1`.
* One edge connects node `n1` to node `c`.
* **Direction:** The arrows on the edges indicate the direction of flow from `a` and `b` to `n1`, and from `n1` to `c`.
### Detailed Analysis or Content Details
* Node `a` is connected to node `n1` via a horizontal line with an arrow pointing towards `n1`.
* Node `b` is connected to node `n1` via a horizontal line with an arrow pointing towards `n1`.
* Node `n1` is connected to node `c` via a horizontal line with an arrow pointing towards `c`.
### Key Observations
* The diagram shows a simple network where two inputs (`a` and `b`) are processed by a single node (`n1`) to produce a single output (`c`).
* The flow is unidirectional, as indicated by the arrows.
### Interpretation
The diagram represents a basic data flow or process flow. It could represent a variety of scenarios, such as:
* Two data sources (`a` and `b`) feeding into a processing unit (`n1`) that generates an output (`c`).
* Two resources (`a` and `b`) being combined or processed by a single entity (`n1`) to produce a final product (`c`).
* A simplified model of a communication network where `a` and `b` send data to `n1`, which then forwards it to `c`.
The diagram is abstract and does not provide specific details about the nature of the data, processes, or resources involved.