\n
## Diagram: Simple Network Flow
### Overview
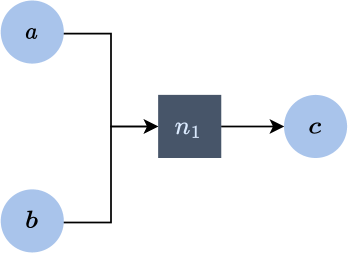
The image depicts a simple network flow diagram with three nodes (a, b, c) and one processing node (n1). Arrows indicate the direction of flow from nodes 'a' and 'b' into node 'n1', and from node 'n1' to node 'c'. The diagram is schematic and does not contain numerical data.
### Components/Axes
The diagram consists of:
* **Nodes:** 'a', 'b', 'c' - represented as light blue circles.
* **Processing Node:** 'n1' - represented as a dark gray square.
* **Arrows:** Indicating the direction of flow between nodes.
### Detailed Analysis or Content Details
* Node 'a' is positioned in the top-left of the diagram.
* Node 'b' is positioned in the bottom-left of the diagram.
* Node 'c' is positioned in the top-right of the diagram.
* Node 'n1' is positioned in the center of the diagram.
* An arrow originates from node 'a' and points towards node 'n1'.
* An arrow originates from node 'b' and points towards node 'n1'.
* An arrow originates from node 'n1' and points towards node 'c'.
* The label "n1" is centered within the dark gray square.
### Key Observations
The diagram illustrates a basic flow structure where inputs from 'a' and 'b' are processed by 'n1' to produce an output 'c'. There is no indication of the quantity or nature of the flow.
### Interpretation
This diagram represents a simplified model of a system where two inputs ('a' and 'b') converge at a processing unit ('n1') to generate a single output ('c'). It could represent a logical operation, a physical process, or any other system where inputs are transformed into an output. The diagram is abstract and does not provide any quantitative information about the flow. It is a conceptual representation of a process rather than a detailed data visualization. The diagram suggests a sequential process where 'n1' acts as a central processing element.