## Chart: Cross Sections of J(x)
### Overview
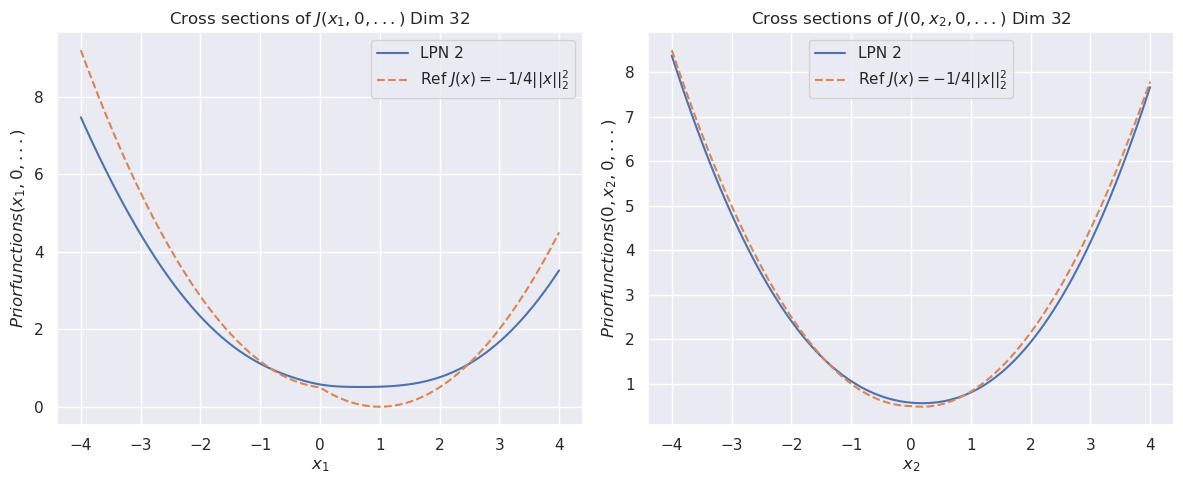
The image presents two line charts, each displaying cross-sections of a function J. The left chart shows the cross-section J(x1, 0, ...), while the right chart shows J(0, x2, 0, ...). Both charts compare two functions: "LPN 2" and "Ref J(x) = -1/4||x||²". The horizontal axis represents x1 and x2 respectively, and the vertical axis represents the prior functions. The dimension is specified as 32 for both.
### Components/Axes
* **Titles:**
* Left Chart: "Cross sections of J(x1, 0,...) Dim 32"
* Right Chart: "Cross sections of J(0, x2, 0,...) Dim 32"
* **X-axis:**
* Left Chart: x1, scale from -4 to 4
* Right Chart: x2, scale from -4 to 4
* **Y-axis:**
* Left Chart: Priorfunctions(x1, 0, ...), scale from 0 to 8
* Right Chart: Priorfunctions(0, x2, 0, ...), scale from 0 to 8
* **Legend:** (Located in the top-center of each chart)
* Blue solid line: LPN 2
* Orange dashed line: Ref J(x) = -1/4||x||²
### Detailed Analysis
**Left Chart: Cross sections of J(x1, 0,...) Dim 32**
* **LPN 2 (Blue Solid Line):**
* Trend: The line forms a U-shape, decreasing from x1 = -4 to a minimum around x1 = 0, then increasing to x1 = 4.
* Approximate Data Points:
* x1 = -4, Priorfunctions(x1, 0, ...) ≈ 7
* x1 = -2, Priorfunctions(x1, 0, ...) ≈ 2
* x1 = 0, Priorfunctions(x1, 0, ...) ≈ 0.5
* x1 = 2, Priorfunctions(x1, 0, ...) ≈ 2
* x1 = 4, Priorfunctions(x1, 0, ...) ≈ 7
* **Ref J(x) = -1/4||x||² (Orange Dashed Line):**
* Trend: The line forms a U-shape, decreasing from x1 = -4 to a minimum around x1 = 0, then increasing to x1 = 4.
* Approximate Data Points:
* x1 = -4, Priorfunctions(x1, 0, ...) ≈ 9
* x1 = -2, Priorfunctions(x1, 0, ...) ≈ 1
* x1 = 0, Priorfunctions(x1, 0, ...) ≈ 0
* x1 = 2, Priorfunctions(x1, 0, ...) ≈ 1
* x1 = 4, Priorfunctions(x1, 0, ...) ≈ 4
**Right Chart: Cross sections of J(0, x2, 0,...) Dim 32**
* **LPN 2 (Blue Solid Line):**
* Trend: The line forms a U-shape, decreasing from x2 = -4 to a minimum around x2 = 0, then increasing to x2 = 4.
* Approximate Data Points:
* x2 = -4, Priorfunctions(0, x2, 0, ...) ≈ 8
* x2 = -2, Priorfunctions(0, x2, 0, ...) ≈ 2
* x2 = 0, Priorfunctions(0, x2, 0, ...) ≈ 0.5
* x2 = 2, Priorfunctions(0, x2, 0, ...) ≈ 2
* x2 = 4, Priorfunctions(0, x2, 0, ...) ≈ 8
* **Ref J(x) = -1/4||x||² (Orange Dashed Line):**
* Trend: The line forms a U-shape, decreasing from x2 = -4 to a minimum around x2 = 0, then increasing to x2 = 4.
* Approximate Data Points:
* x2 = -4, Priorfunctions(0, x2, 0, ...) ≈ 8
* x2 = -2, Priorfunctions(0, x2, 0, ...) ≈ 1
* x2 = 0, Priorfunctions(0, x2, 0, ...) ≈ 0
* x2 = 2, Priorfunctions(0, x2, 0, ...) ≈ 1
* x2 = 4, Priorfunctions(0, x2, 0, ...) ≈ 8
### Key Observations
* Both charts show similar U-shaped curves for both "LPN 2" and "Ref J(x)".
* In the left chart, the "Ref J(x)" curve is initially above the "LPN 2" curve for negative x1 values, but they converge as they approach x1 = 0.
* In the right chart, the "LPN 2" and "Ref J(x)" curves are very close to each other.
* The minimum value of "LPN 2" is slightly higher than that of "Ref J(x)" in both charts.
### Interpretation
The charts compare the cross-sections of a function J using two different methods, "LPN 2" and a reference function "Ref J(x)". The similarity in the shapes of the curves suggests that "LPN 2" approximates the reference function reasonably well, especially in the right chart where the curves are almost identical. The left chart shows some deviation between the two functions, particularly for negative x1 values, indicating that the approximation might be less accurate in that region. The fact that the minimum value of "LPN 2" is slightly higher than "Ref J(x)" in both charts could indicate a systematic bias in the "LPN 2" approximation. The dimension of 32 suggests that the function J is defined in a high-dimensional space, and these cross-sections provide insights into its behavior along specific axes.