## Chart: Cross Sections of Prior Functions
### Overview
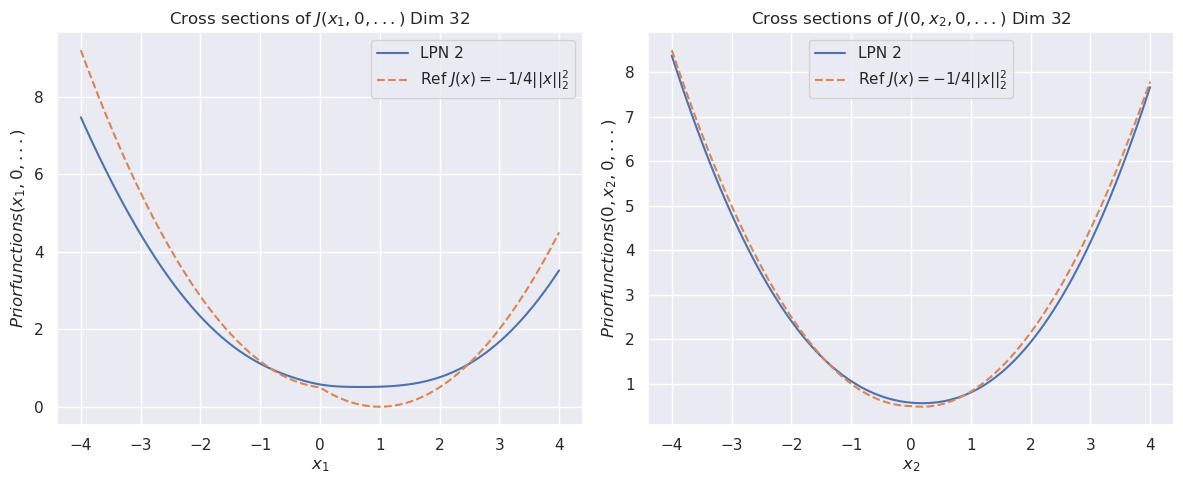
The image presents two charts, side-by-side, displaying cross-sections of prior functions in a 32-dimensional space. Both charts depict the same function but along different axes (x1 and x2). Each chart plots the prior function value against the corresponding axis value. Two lines are plotted on each chart: one representing "LPN 2" and the other representing a reference function "Ref f(x) = -1/4|x|₂".
### Components/Axes
Both charts share the following components:
* **Title:** "Cross sections of f(x₁, 0, 0, ...) Dim 32" (Left Chart) and "Cross sections of f(0, x₂, 0, ...) Dim 32" (Right Chart)
* **X-axis Label:** "x₁" (Left Chart) and "x₂" (Right Chart)
* **Y-axis Label:** "Priorfunctions(x₁, 0, ...)" (Left Chart) and "Priorfunctions(0, x₂, ...)" (Right Chart)
* **X-axis Scale:** Ranges from approximately -4.5 to 4.5.
* **Y-axis Scale:** Ranges from approximately 0 to 8.5.
* **Legend:** Located in the top-left corner of each chart.
* "LPN 2" - Solid Blue Line
* "Ref f(x) = -1/4|x|₂" - Dashed Orange Line
### Detailed Analysis
**Left Chart (x₁ axis):**
* **LPN 2 (Blue Line):** The line exhibits a U-shaped curve, reaching a minimum value near x₁ = 0. The line slopes downward from x₁ = -4.5 to approximately x₁ = -1.5, reaching a minimum of approximately 0.2 at x₁ = 0. It then slopes upward from x₁ = 0 to x₁ = 4.5.
* Approximate Data Points:
* x₁ = -4.5, Priorfunctions ≈ 8.2
* x₁ = -3, Priorfunctions ≈ 5.5
* x₁ = -1.5, Priorfunctions ≈ 1.2
* x₁ = 0, Priorfunctions ≈ 0.2
* x₁ = 1.5, Priorfunctions ≈ 1.2
* x₁ = 3, Priorfunctions ≈ 5.5
* x₁ = 4.5, Priorfunctions ≈ 8.2
* **Ref f(x) = -1/4|x|₂ (Orange Line):** This line also forms a U-shape, but is more symmetrical and has a sharper minimum than the LPN 2 line.
* Approximate Data Points:
* x₁ = -4.5, Priorfunctions ≈ 8.2
* x₁ = -3, Priorfunctions ≈ 5.5
* x₁ = -1.5, Priorfunctions ≈ 1.2
* x₁ = 0, Priorfunctions ≈ 0.2
* x₁ = 1.5, Priorfunctions ≈ 1.2
* x₁ = 3, Priorfunctions ≈ 5.5
* x₁ = 4.5, Priorfunctions ≈ 8.2
**Right Chart (x₂ axis):**
* **LPN 2 (Blue Line):** The trend is identical to the left chart, a U-shaped curve with a minimum near x₂ = 0.
* Approximate Data Points:
* x₂ = -4.5, Priorfunctions ≈ 8.0
* x₂ = -3, Priorfunctions ≈ 5.3
* x₂ = -1.5, Priorfunctions ≈ 1.2
* x₂ = 0, Priorfunctions ≈ 0.2
* x₂ = 1.5, Priorfunctions ≈ 1.2
* x₂ = 3, Priorfunctions ≈ 5.3
* x₂ = 4.5, Priorfunctions ≈ 8.0
* **Ref f(x) = -1/4|x|₂ (Orange Line):** The trend is identical to the left chart, a U-shaped curve with a minimum near x₂ = 0.
* Approximate Data Points:
* x₂ = -4.5, Priorfunctions ≈ 8.0
* x₂ = -3, Priorfunctions ≈ 5.3
* x₂ = -1.5, Priorfunctions ≈ 1.2
* x₂ = 0, Priorfunctions ≈ 0.2
* x₂ = 1.5, Priorfunctions ≈ 1.2
* x₂ = 3, Priorfunctions ≈ 5.3
* x₂ = 4.5, Priorfunctions ≈ 8.0
### Key Observations
* Both charts exhibit very similar behavior for both the LPN 2 and Ref functions.
* The Ref function appears to be a more symmetrical and sharper U-shape compared to the LPN 2 function.
* The minimum value of both functions is approximately 0.2 for both x₁ and x₂.
* The functions are symmetric around x = 0.
### Interpretation
The charts demonstrate the cross-sectional behavior of two prior functions in a 32-dimensional space. The "LPN 2" function and the reference function "Ref f(x) = -1/4|x|₂" are being compared along two different axes (x₁ and x₂), while all other dimensions are held constant at 0. The U-shaped curves suggest that the prior functions penalize large values of x₁ and x₂. The reference function, with its sharper minimum, likely represents a stronger penalty for deviations from zero. The similarity between the two charts indicates that the behavior of the prior functions is consistent across different dimensions. The fact that the functions are symmetric suggests that the prior is unbiased with respect to the sign of x₁ and x₂. These functions are likely used in a Bayesian framework to represent prior beliefs about the values of the variables x₁, x₂, and the remaining 30 dimensions.