## Cross-Sectional Analysis of Prior Functions in 32 Dimensions
### Overview
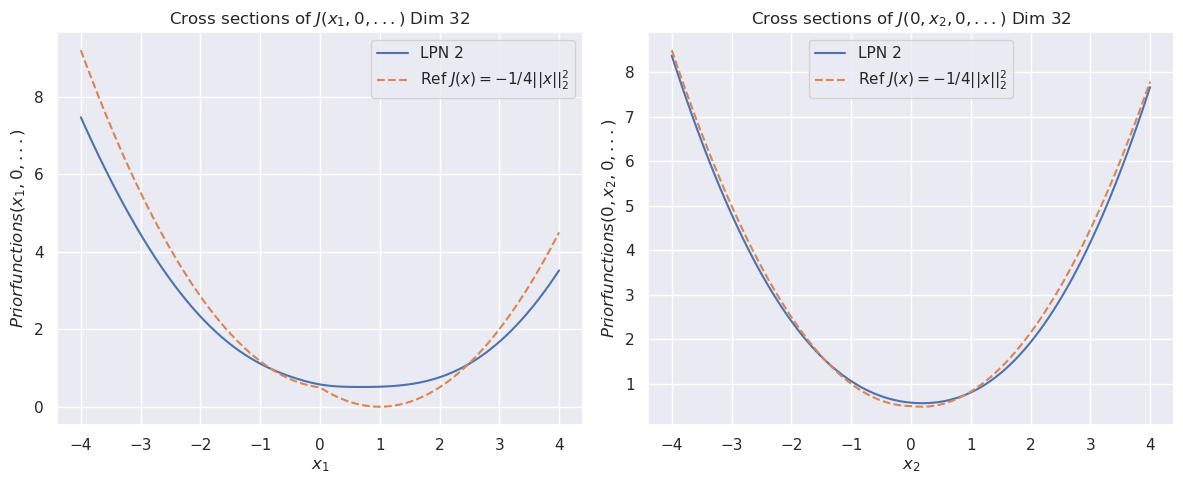
The image displays two side-by-side line charts comparing the cross-sectional behavior of a learned prior function ("LPN 2") against a theoretical reference function in a 32-dimensional space. Both charts plot the value of a "Priorfunction" against a single variable while holding other dimensions at zero, revealing parabolic, U-shaped curves.
### Components/Axes
**Titles:**
- Left Chart: "Cross sections of J(x₁, 0, ...) Dim 32"
- Right Chart: "Cross sections of J(0, x₂, 0, ...) Dim 32"
**Axes:**
- **Left Chart X-axis:** Label: `x₁`. Scale: Linear, from -4 to 4 with major ticks at every integer.
- **Right Chart X-axis:** Label: `x₂`. Scale: Linear, from -4 to 4 with major ticks at every integer.
- **Both Charts Y-axis:** Label: `Priorfunctions(x₁, 0, ...)` (left) and `Priorfunctions(0, x₂, 0, ...)` (right). Scale: Linear, from 0 to 8 with major ticks at every integer.
**Legend (Present in both charts, positioned top-right):**
- **Solid Blue Line:** Label: `LPN 2`
- **Dashed Orange Line:** Label: `Ref J(x) = -1/4||x||₂²`
### Detailed Analysis
**Left Chart (Varying x₁):**
- **Trend Verification:** Both curves are symmetric, upward-opening parabolas centered at x₁ = 0.
- **Data Series - LPN 2 (Blue):**
- Minimum value at x₁ = 0 is approximately 0.5.
- At x₁ = ±4, the value is approximately 3.5.
- The curve is smooth and slightly wider than the reference.
- **Data Series - Reference (Orange Dashed):**
- Minimum value at x₁ = 0 is 0.
- At x₁ = ±4, the value is approximately 4.5.
- The curve is a perfect parabola defined by the function `-1/4 * (x₁²)`. Note: The plotted values are positive, indicating the y-axis likely represents the *negative* of the function J(x) or a related prior probability density.
**Right Chart (Varying x₂):**
- **Trend Verification:** Both curves are symmetric, upward-opening parabolas centered at x₂ = 0.
- **Data Series - LPN 2 (Blue):**
- Minimum value at x₂ = 0 is approximately 0.5.
- At x₂ = ±4, the value is approximately 7.5.
- The curve closely follows the reference but is slightly above it across the entire range.
- **Data Series - Reference (Orange Dashed):**
- Minimum value at x₂ = 0 is 0.
- At x₂ = ±4, the value is approximately 7.5.
- The curve is a perfect parabola defined by the function `-1/4 * (x₂²)`.
### Key Observations
1. **Asymmetry in Learned Function:** The "LPN 2" function exhibits different behavior along the x₁ and x₂ dimensions. It deviates more significantly from the reference along x₁ (wider parabola, higher minimum) than along x₂ (very close fit).
2. **Minimum Value Offset:** The learned prior ("LPN 2") has a positive minimum value (~0.5) at the origin in both cross-sections, whereas the reference function's minimum is exactly 0.
3. **Growth Rate Discrepancy:** Along the x₁ dimension, the reference function grows faster than LPN 2 at the extremes (|x₁| > 2). Along the x₂ dimension, their growth rates are nearly identical.
4. **Mathematical Notation:** The reference function is written as `Ref J(x) = -1/4||x||₂²`, where `||x||₂²` denotes the squared L2 norm (sum of squares) of the vector x.
### Interpretation
This visualization is likely from a machine learning or probabilistic modeling context, evaluating how well a learned prior distribution (LPN 2) approximates a target theoretical prior (the reference function) in a high-dimensional space (32D).
- **What the data suggests:** The learned prior successfully captures the general parabolic, convex shape of the reference function, indicating it has learned a meaningful structure. However, the discrepancies are informative:
- The positive minimum suggests the learned prior assigns a non-zero probability density at the origin, unlike the reference.
- The asymmetry between dimensions (x₁ vs. x₂) implies the learned prior is not perfectly isotropic; its behavior varies depending on the direction in the latent space. This could be an artifact of the training process or data.
- **How elements relate:** The two charts together provide a multi-dimensional "slice" view of a complex 32D function. By comparing the slices, we infer properties of the full function. The close match in the x₂ slice versus the poorer match in the x₁ slice highlights dimension-specific learning performance.
- **Notable anomaly:** The most significant anomaly is the consistent vertical offset of the LPN 2 curve from the reference curve, especially at the minima. This systematic bias could impact downstream tasks relying on the prior's calibration. The investigation would focus on why the model learns this offset and whether it is desirable.