## Line Graph: Success Rate vs. Number of Sampled Tactics
### Overview
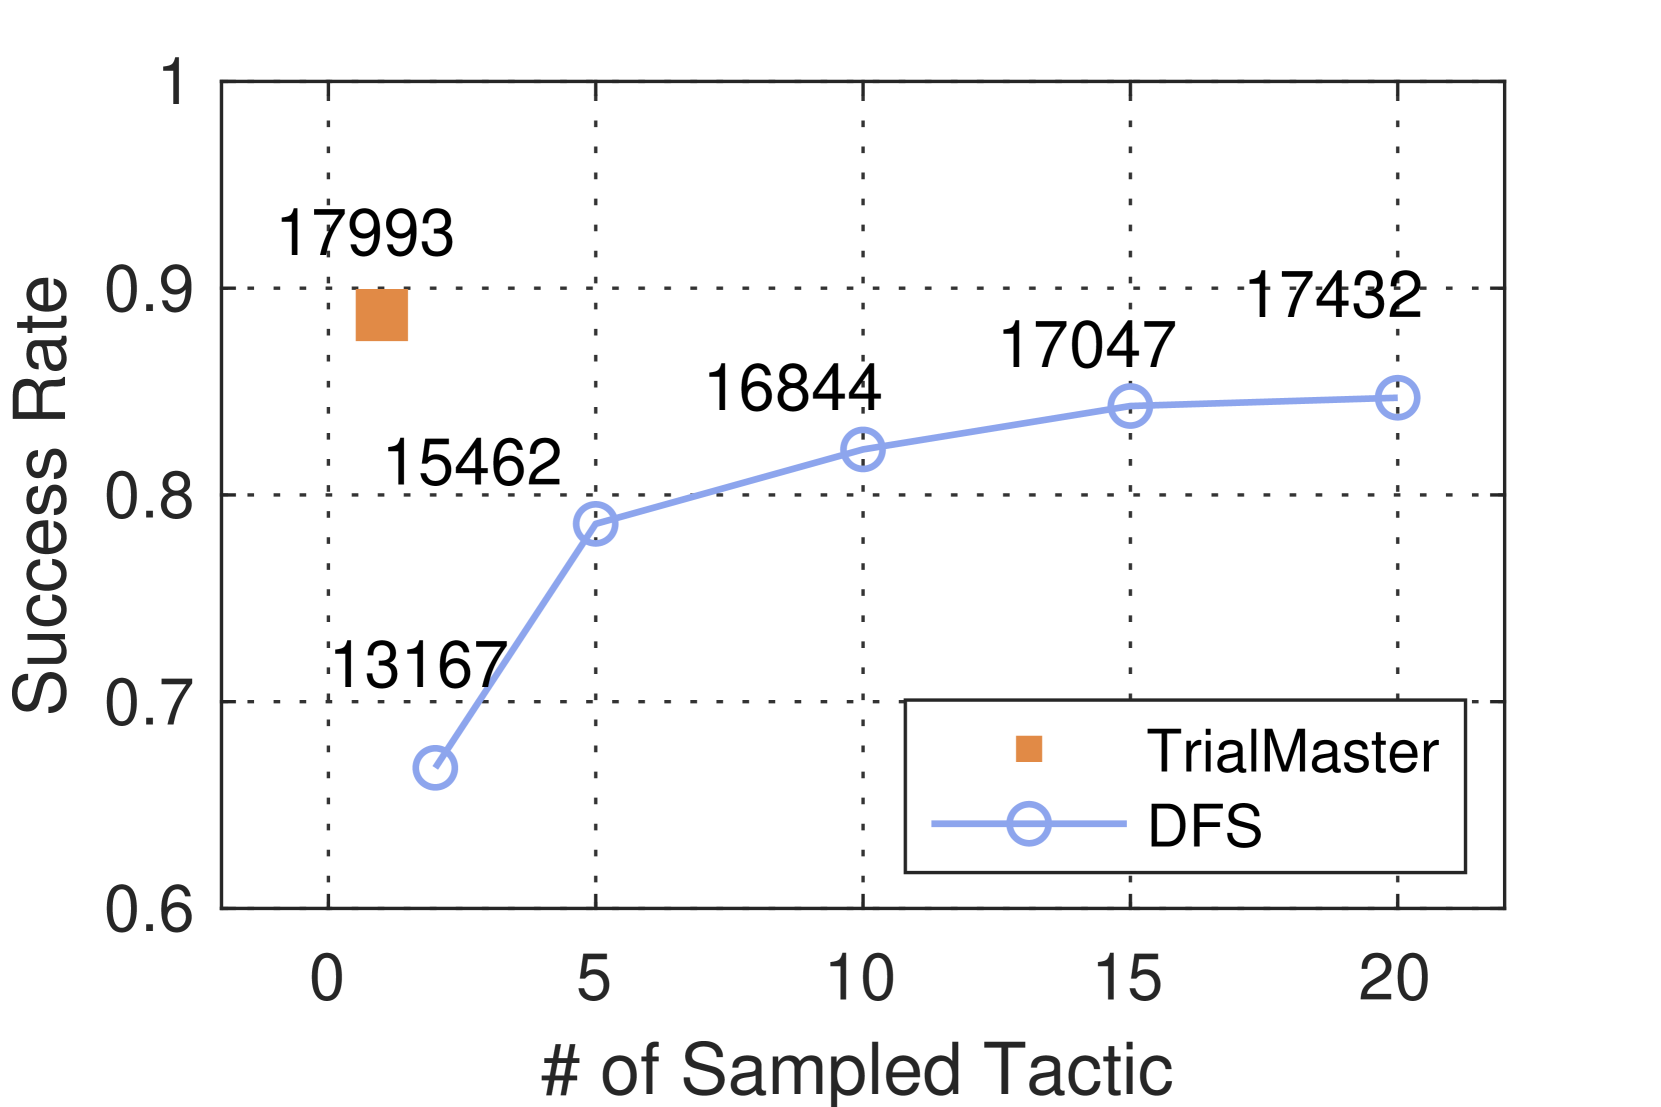
The image is a line graph comparing the success rates of two methods, **TrialMaster** (red square) and **DFS** (blue line with circles), as a function of the number of sampled tactics. The x-axis represents the number of sampled tactics (0–20), and the y-axis represents success rate (0.6–1.0). The graph includes numerical annotations for data points and a legend for method identification.
---
### Components/Axes
- **X-axis**: "# of Sampled Tactic" (0–20, integer increments).
- **Y-axis**: "Success Rate" (0.6–1.0, decimal increments).
- **Legend**:
- Red square: **TrialMaster** (positioned at bottom-right).
- Blue line with circles: **DFS** (positioned at bottom-right).
- **Data Points**:
- **TrialMaster**: Single red square at (0, 0.9) with value **17993**.
- **DFS**: Blue line with circles at:
- (3, 0.7) → **13167**
- (5, 0.8) → **15462**
- (10, 0.82) → **16844**
- (15, 0.85) → **17047**
- (20, 0.86) → **17432**
---
### Detailed Analysis
1. **TrialMaster**:
- Only one data point at **x=0** (no sampled tactics).
- Success rate: **0.9** (90%).
- Numerical value: **17993** (likely a count or metric tied to success rate).
2. **DFS**:
- Success rate increases with more sampled tactics:
- At **x=3**: 0.7 (70%) → 13167
- At **x=5**: 0.8 (80%) → 15462
- At **x=10**: 0.82 (82%) → 16844
- At **x=15**: 0.85 (85%) → 17047
- At **x=20**: 0.86 (86%) → 17432
- Trend: Gradual upward slope, indicating improved performance with more tactics.
---
### Key Observations
- **TrialMaster** achieves a high success rate (0.9) without sampling any tactics, but its performance is not evaluated beyond this point.
- **DFS** shows a clear positive correlation between the number of sampled tactics and success rate, with incremental improvements as tactics increase.
- The numerical values (e.g., 17993, 13167) suggest a secondary metric (e.g., total successes, trials, or another quantifiable outcome) tied to the success rate.
---
### Interpretation
- **TrialMaster** may represent a method that achieves high success rates without requiring tactical sampling (e.g., a static or rule-based approach). However, its lack of data beyond x=0 limits conclusions about scalability.
- **DFS** demonstrates that success improves with increased tactical exploration, suggesting it is better suited for dynamic or adaptive scenarios where sampling more tactics enhances outcomes.
- The numerical values (e.g., 17993 vs. 17432) imply that TrialMaster’s absolute performance (e.g., total successes) is higher at x=0, but DFS catches up and surpasses it in relative success rate as tactics increase.
- The graph highlights a trade-off: TrialMaster is efficient at zero effort, while DFS requires more work but scales better.
---
### Spatial Grounding & Trend Verification
- **Legend**: Bottom-right corner, clearly labels methods with matching colors.
- **TrialMaster**: Red square at (0, 0.9) aligns with legend.
- **DFS**: Blue line with circles follows the x-axis from 3 to 20, with success rate increasing monotonically (verified by upward slope).
- **Axis Markers**: Dotted gridlines at 0.6, 0.7, 0.8, 0.9, 1.0 for y-axis; 0, 5, 10, 15, 20 for x-axis.
---
### Content Details
- **TrialMaster**:
- Single data point: (0, 0.9) → 17993.
- **DFS**:
- Data points: (3, 0.7), (5, 0.8), (10, 0.82), (15, 0.85), (20, 0.86).
- Numerical values: 13167, 15462, 16844, 17047, 17432.
---
### Notable Anomalies
- **TrialMaster** lacks data beyond x=0, making it impossible to assess its performance at higher tactic counts.
- **DFS** shows diminishing returns: The rate of improvement slows as tactics increase (e.g., 0.82 to 0.85 between x=10 and x=15, then 0.85 to 0.86 between x=15 and x=20).
---
### Final Notes
The graph emphasizes the importance of tactical sampling for DFS, while TrialMaster’s static performance suggests it may be less adaptable. Further data for TrialMaster at higher tactic counts would clarify its scalability.