## Line Chart: Success Rate vs. Number of Sampled Tactics
### Overview
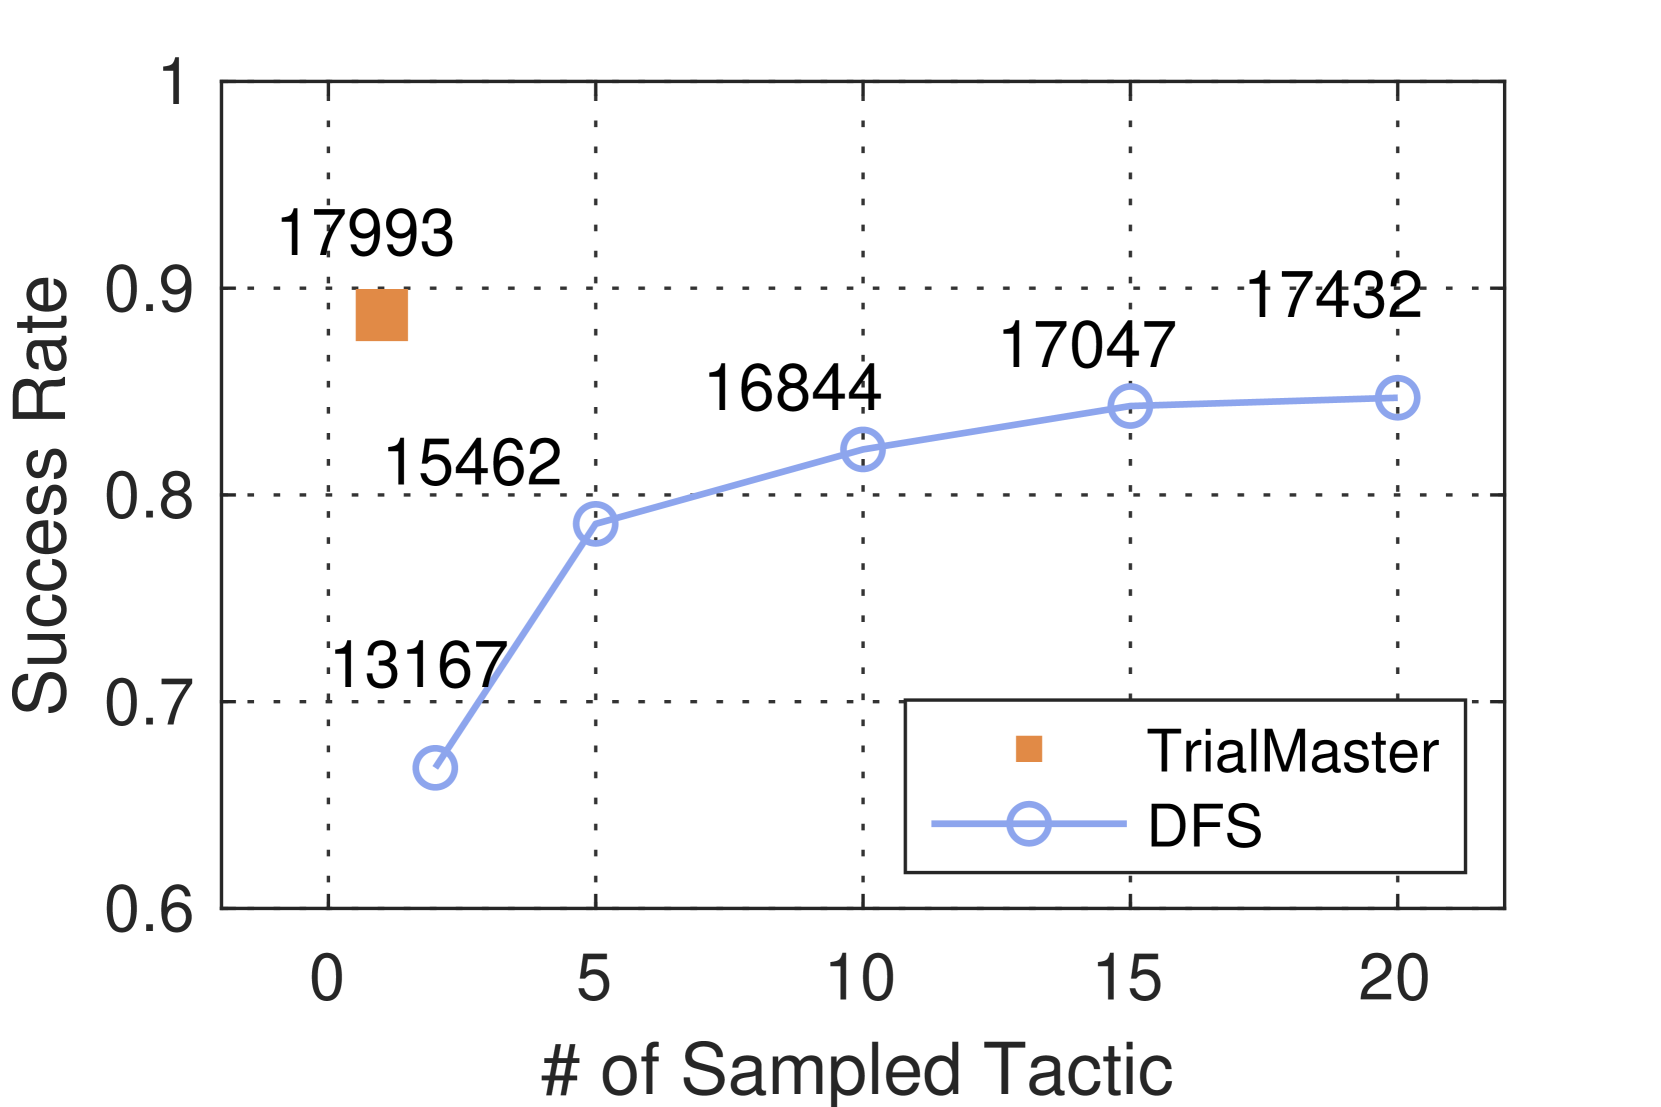
The image is a line chart comparing the success rate of two methods, TrialMaster and DFS (Depth-First Search), against the number of sampled tactics. The x-axis represents the number of sampled tactics, ranging from 0 to 20. The y-axis represents the success rate, ranging from 0.6 to 1.0. The chart shows that the success rate of DFS increases with the number of sampled tactics, while TrialMaster has a single data point.
### Components/Axes
* **X-axis:** "# of Sampled Tactic" with markers at 0, 5, 10, 15, and 20.
* **Y-axis:** "Success Rate" with markers at 0.6, 0.7, 0.8, 0.9, and 1.
* **Legend:** Located in the bottom-right corner.
* Orange square: TrialMaster
* Blue line with circle markers: DFS
* **Data Labels:** Numerical values are placed near each data point.
### Detailed Analysis
* **TrialMaster:** Represented by an orange square. There is only one data point for TrialMaster.
* At 0 sampled tactics, the success rate is 0.9, labeled as 17993.
* **DFS:** Represented by a blue line with circle markers. The line shows an increasing trend in success rate as the number of sampled tactics increases.
* At 0 sampled tactics, the success rate is approximately 0.67, labeled as 13167.
* At 5 sampled tactics, the success rate is approximately 0.78, labeled as 15462.
* At 10 sampled tactics, the success rate is approximately 0.83, labeled as 16844.
* At 15 sampled tactics, the success rate is approximately 0.84, labeled as 17047.
* At 20 sampled tactics, the success rate is approximately 0.85, labeled as 17432.
### Key Observations
* The success rate of DFS increases rapidly from 0 to 5 sampled tactics.
* The success rate of DFS increases at a slower rate after 5 sampled tactics, approaching a plateau.
* TrialMaster has a higher success rate than DFS at 0 sampled tactics.
### Interpretation
The chart suggests that increasing the number of sampled tactics improves the success rate of the DFS method. However, the improvement diminishes as the number of sampled tactics increases, indicating a potential point of diminishing returns. The single data point for TrialMaster suggests it may perform better than DFS with no sampled tactics, but further data is needed to draw a comprehensive comparison. The numbers near the data points (13167, 15462, 16844, 17047, 17432, 17993) likely represent the number of trials or attempts made at each data point.