\n
## Line Chart: Success Rate vs. Number of Sampled Tactics
### Overview
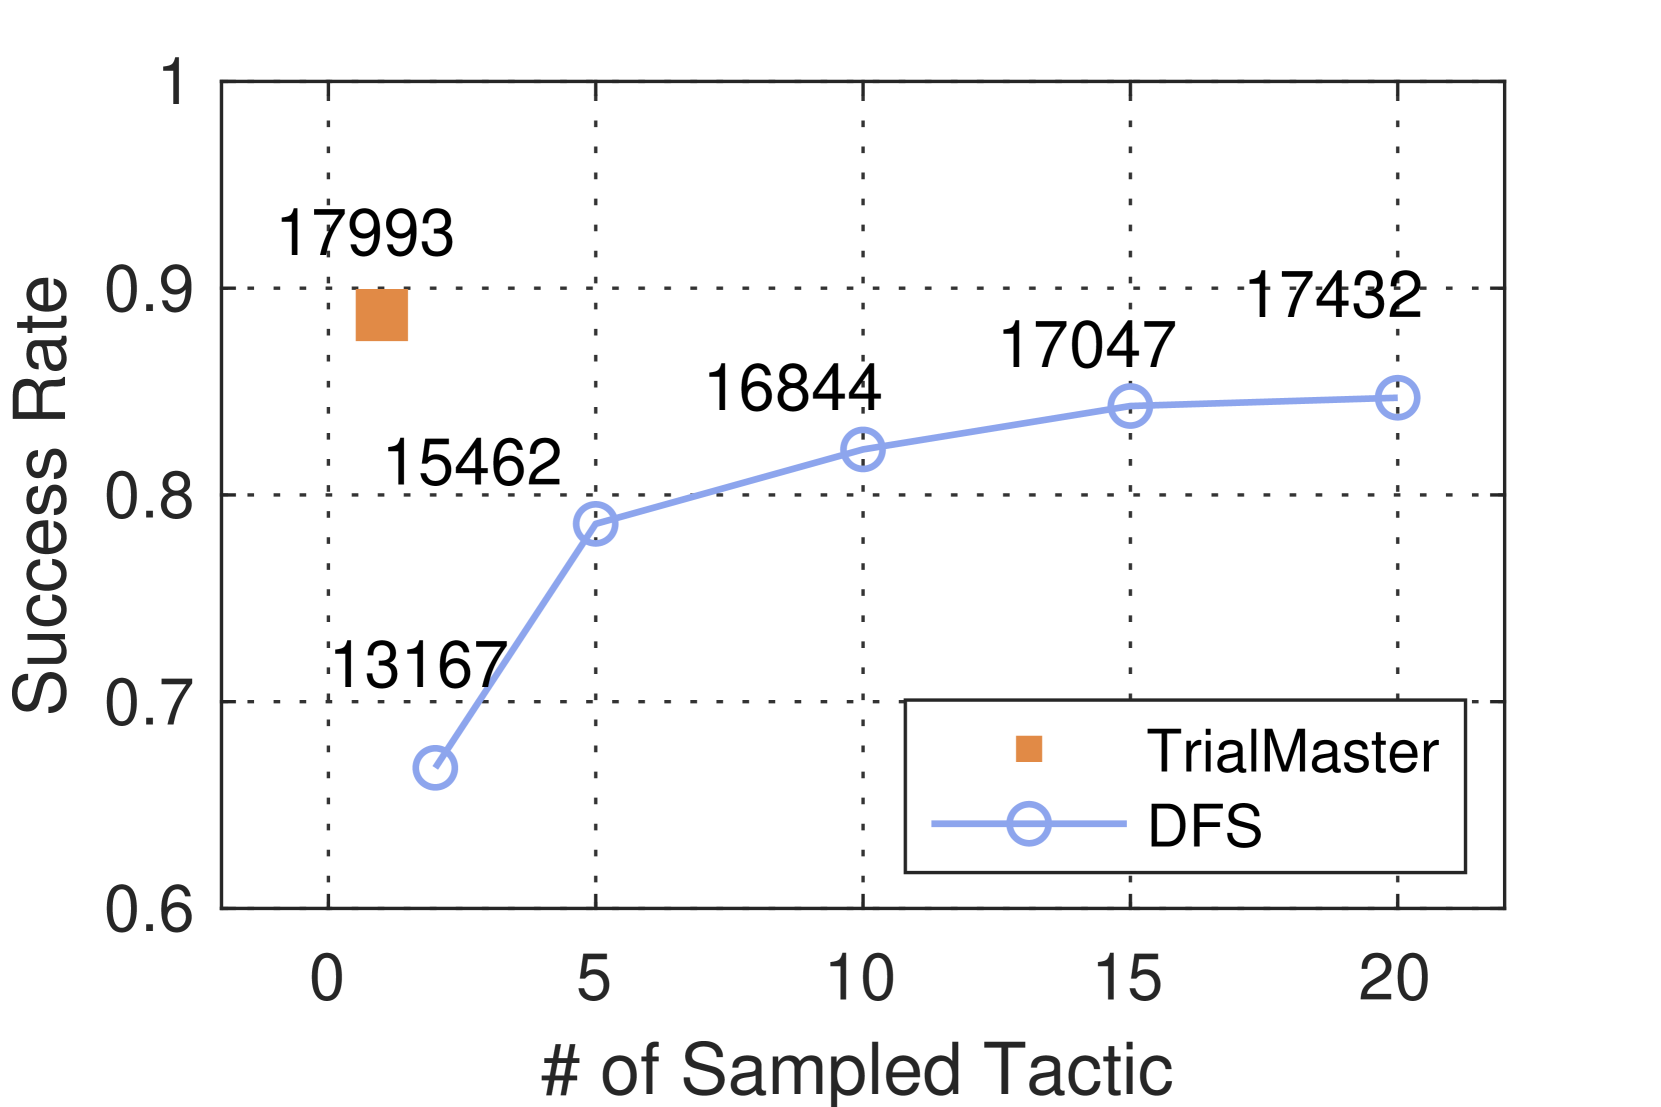
This image presents a line chart comparing the success rate of two algorithms, TrialMaster and DFS (Depth-First Search), as a function of the number of sampled tactics. The chart displays the success rate on the y-axis and the number of sampled tactics on the x-axis. Data points are plotted for both algorithms at various tactic sampling levels.
### Components/Axes
* **X-axis:** "# of Sampled Tactic" - Ranging from 0 to 20, with tick marks at 0, 5, 10, 15, and 20.
* **Y-axis:** "Success Rate" - Ranging from 0.6 to 1.0, with tick marks at 0.6, 0.7, 0.8, 0.9, and 1.0.
* **Legend:** Located in the bottom-right corner.
* TrialMaster: Represented by an orange square.
* DFS: Represented by a blue circle with a white center.
* **Data Series:** Two lines representing the success rate for each algorithm.
* **Data Points:** Numerical values are displayed next to each data point.
### Detailed Analysis
**TrialMaster (Orange Squares):**
The TrialMaster line is a single data point at x=0. The line is flat, as there is only one data point.
* At 0 sampled tactics, the success rate is approximately 0.92 (value: 17993).
**DFS (Blue Circles):**
The DFS line shows a generally increasing trend, leveling off towards the right side of the chart.
* At 0 sampled tactics, the success rate is approximately 0.68 (value: 13167).
* At 5 sampled tactics, the success rate is approximately 0.79 (value: 15462).
* At 10 sampled tactics, the success rate is approximately 0.85 (value: 16844).
* At 15 sampled tactics, the success rate is approximately 0.87 (value: 17047).
* At 20 sampled tactics, the success rate is approximately 0.86 (value: 17432).
### Key Observations
* TrialMaster achieves a higher success rate than DFS at 0 sampled tactics.
* DFS shows improvement in success rate as the number of sampled tactics increases, but the improvement diminishes at higher sampling levels.
* The success rate of DFS plateaus around 0.86-0.87 with increasing sampled tactics.
* The values next to the data points are significantly larger than the success rate values, suggesting they may represent a different metric (e.g., number of trials).
### Interpretation
The chart compares the performance of two algorithms, TrialMaster and DFS, in a search or optimization context. The "Success Rate" likely represents the probability of finding a satisfactory solution, and the "# of Sampled Tactic" represents the computational effort expended.
TrialMaster appears to be more effective when no tactics are sampled, potentially indicating a strong initial heuristic or a simpler problem structure. DFS, on the other hand, benefits from increased sampling, suggesting it relies on exploring a larger search space to find good solutions. However, the diminishing returns of sampling for DFS suggest that there's a point where further exploration doesn't significantly improve the success rate.
The large numerical values associated with each data point (13167, 15462, etc.) are likely the number of trials performed at each sampling level. This allows for a more robust estimation of the success rate. The fact that these numbers are increasing alongside the success rate for DFS suggests that more trials lead to a more accurate estimate of the algorithm's performance.
The chart suggests that the optimal strategy depends on the available computational resources. If resources are limited, TrialMaster might be preferred. If more resources are available, DFS can achieve a comparable success rate with sufficient sampling.