\n
## Line Chart: Success Rate vs. Number of Sampled Tactics
### Overview
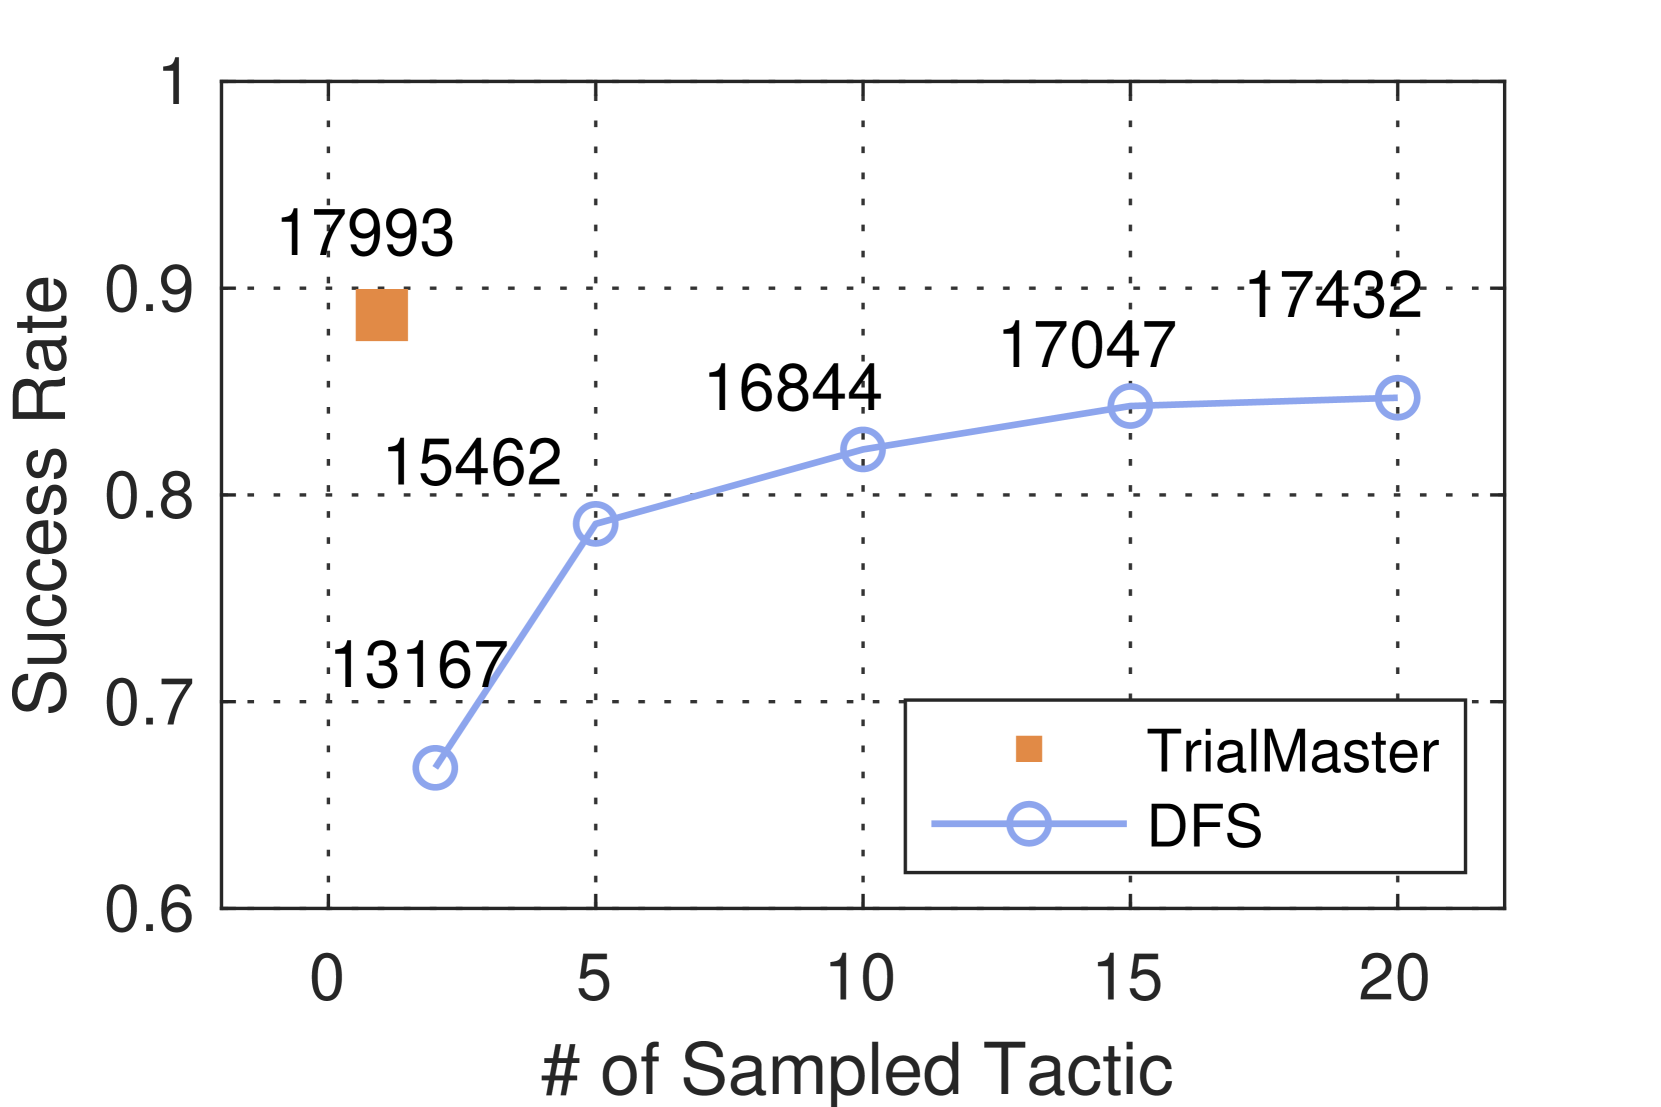
The image is a 2D line chart comparing the performance of two methods, "TrialMaster" and "DFS," based on their "Success Rate" as a function of the "# of Sampled Tactic." The chart includes a grid, labeled axes, data points with numerical annotations, and a legend.
### Components/Axes
* **Chart Type:** Line chart with markers.
* **X-Axis:** Labeled "# of Sampled Tactic". The axis has major tick marks and grid lines at values 0, 5, 10, 15, and 20.
* **Y-Axis:** Labeled "Success Rate". The axis has major tick marks and grid lines at values 0.6, 0.7, 0.8, 0.9, and 1.0.
* **Legend:** Located in the bottom-right quadrant of the chart area.
* An orange square symbol is labeled "TrialMaster".
* A light blue line with an open circle marker is labeled "DFS".
* **Data Series & Annotations:**
1. **TrialMaster (Orange Square):** A single data point located at approximately (x=0, y=0.89). The number "17993" is printed directly above this point.
2. **DFS (Light Blue Line with Circles):** A series of five connected data points. Each point has a number printed above it.
* Point 1: At (x=0, y≈0.67). Annotation: "13167".
* Point 2: At (x=5, y≈0.79). Annotation: "15462".
* Point 3: At (x=10, y≈0.82). Annotation: "16844".
* Point 4: At (x=15, y≈0.84). Annotation: "17047".
* Point 5: At (x=20, y≈0.85). Annotation: "17432".
### Detailed Analysis
* **Trend Verification:**
* **DFS Series:** The light blue line shows a clear upward trend. It starts at a lower success rate (~0.67) when the number of sampled tactics is 0 and increases monotonically as the number of sampled tactics increases, showing a steep initial rise between 0 and 5 tactics, followed by a more gradual increase.
* **TrialMaster Series:** This is a single, isolated data point with no associated trend line. It represents a high success rate (~0.89) at 0 sampled tactics.
* **Data Point Extraction (Approximate Y-values based on grid):**
| Method | # of Sampled Tactic (X) | Success Rate (Y, Approx.) | Annotation Number |
| :--- | :--- | :--- | :--- |
| TrialMaster | 0 | 0.89 | 17993 |
| DFS | 0 | 0.67 | 13167 |
| DFS | 5 | 0.79 | 15462 |
| DFS | 10 | 0.82 | 16844 |
| DFS | 15 | 0.84 | 17047 |
| DFS | 20 | 0.85 | 17432 |
### Key Observations
1. **Performance Crossover:** At 0 sampled tactics, TrialMaster (0.89) significantly outperforms DFS (0.67). However, the DFS method's success rate improves with more sampling. By 5 sampled tactics, DFS (0.79) has nearly closed the gap, and for 10 or more sampled tactics, DFS achieves a success rate (0.82-0.85) that approaches but remains slightly below the single TrialMaster data point.
2. **Diminishing Returns for DFS:** The DFS curve shows diminishing returns. The largest gain in success rate occurs between 0 and 5 sampled tactics (+0.12). Subsequent increases of 5 tactics yield smaller gains: +0.03 (5 to 10), +0.02 (10 to 15), and +0.01 (15 to 20).
3. **Annotation Numbers:** The numbers above each data point (e.g., 17993, 13167) increase for the DFS series as the number of sampled tactics increases. Their exact meaning is not defined by the chart labels but could represent sample sizes, computation counts, or unique identifiers associated with each data point.
### Interpretation
The chart demonstrates a comparative analysis between two distinct approaches. **TrialMaster** appears to be a method that achieves a high, fixed success rate (~89%) without requiring the sampling of tactics (at x=0). In contrast, **DFS** is a method whose success is dependent on the number of tactics sampled; it starts with a lower baseline performance but improves with increased sampling effort.
The data suggests a trade-off: TrialMaster may be a more efficient or pre-optimized solution for scenarios where sampling is costly or impossible, as it delivers high performance immediately. DFS, however, is an adaptive or iterative method where performance scales with resource investment (number of sampled tactics). The diminishing returns curve for DFS indicates that while initial sampling is highly beneficial, there is a practical limit to the performance gain achievable through this method alone, as it asymptotically approaches but does not surpass the TrialMaster benchmark within the plotted range. The annotation numbers, which grow with sampling for DFS, might correlate with the computational cost or data volume required to achieve each success rate level.