# Technical Document Extraction: Model Error Rate / Attempts Comparison
## 1. Document Overview
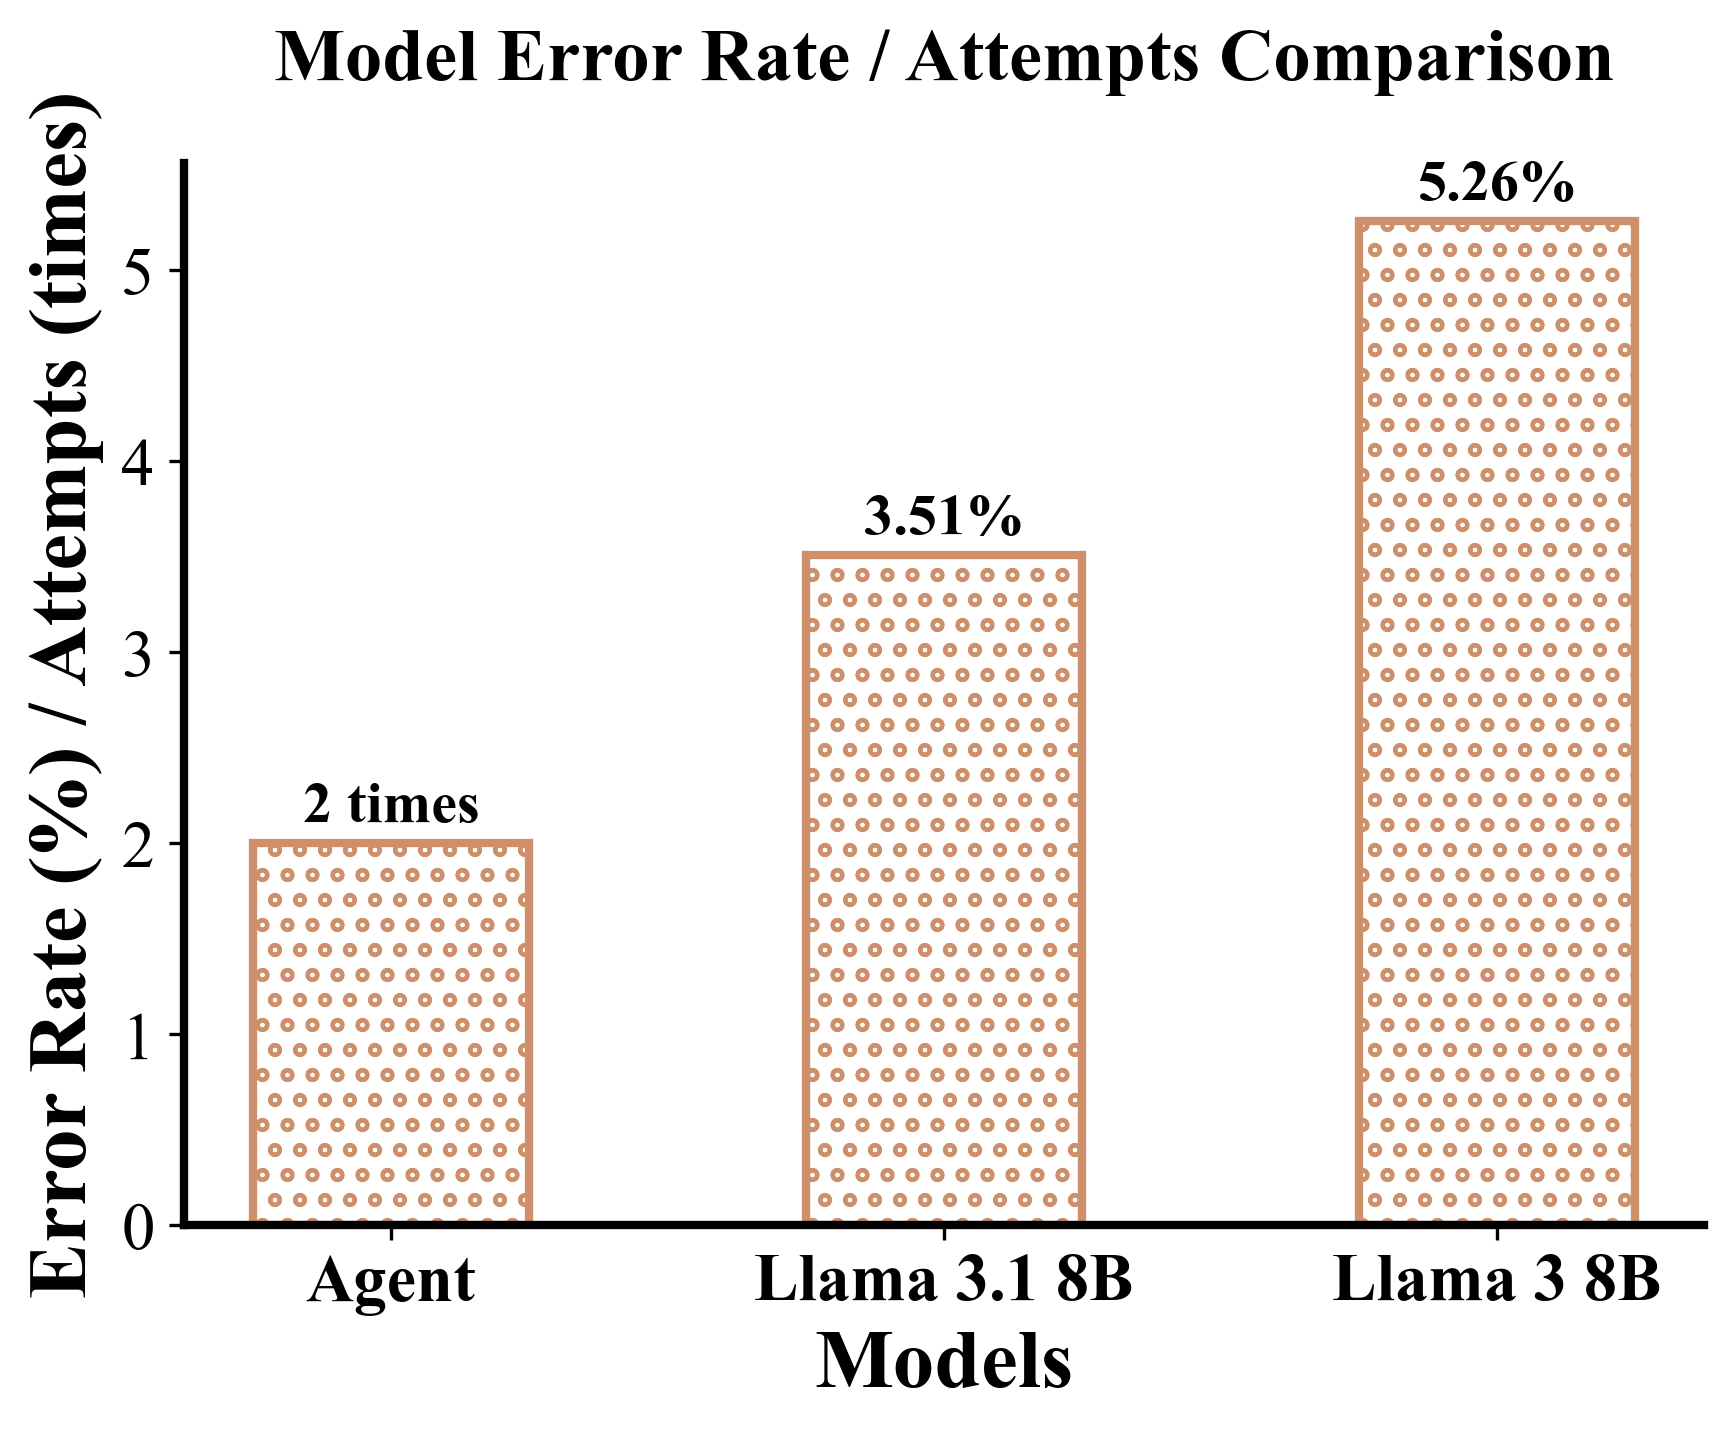
This image is a vertical bar chart comparing the performance of three different AI model configurations based on their error rates or number of attempts. The chart uses a consistent visual style with tan-colored bars filled with a circular pattern.
## 2. Component Isolation
### Header
* **Title:** Model Error Rate / Attempts Comparison
### Main Chart Area
* **Y-Axis Label:** Error Rate (%) / Attempts (times)
* **Y-Axis Scale:** Numerical markers from 0 to 5, with increments of 1.
* **X-Axis Label:** Models
* **X-Axis Categories:** Agent, Llama 3.1 8B, Llama 3 8B
* **Data Visualization:** Three vertical bars of increasing height from left to right.
## 3. Data Extraction and Table Reconstruction
The following table represents the data points extracted from the chart. Note that the Y-axis units are mixed (percentage vs. count) depending on the specific model label provided above the bar.
| Model (X-Axis) | Value (Label Above Bar) | Visual Height (Y-Axis) |
| :--- | :--- | :--- |
| **Agent** | 2 times | Exactly at the 2 mark |
| **Llama 3.1 8B** | 3.51% | Midway between 3 and 4 |
| **Llama 3 8B** | 5.26% | Slightly above the 5 mark |
## 4. Trend Verification and Analysis
* **Visual Trend:** The bars show a clear upward slope from left to right. The "Agent" configuration has the lowest value, followed by "Llama 3.1 8B", with "Llama 3 8B" showing the highest value.
* **Comparative Analysis:**
* The **Agent** is the most efficient/accurate, requiring only "2 times" (presumably attempts) or having the lowest relative error.
* **Llama 3.1 8B** shows a significant improvement over its predecessor, with an error rate of **3.51%**.
* **Llama 3 8B** has the highest error rate in this comparison at **5.26%**.
* **Unit Discrepancy:** It is important to note that the first bar is labeled in "times" (attempts), while the subsequent two bars are labeled in percentages (error rate). The Y-axis title "Error Rate (%) / Attempts (times)" accounts for this dual-unit representation.
## 5. Spatial Grounding and Labels
* **Title Placement:** Top center.
* **Y-Axis:** Located on the left vertical edge.
* **X-Axis:** Located on the bottom horizontal edge.
* **Bar Styling:** All bars share the same tan border and internal "polka-dot" or circular fill pattern. There is no color-coded legend because the categories are explicitly labeled on the X-axis.