\n
## Bar Charts: Prediction Flip Rate Comparison for Llama-3.2 Models
### Overview
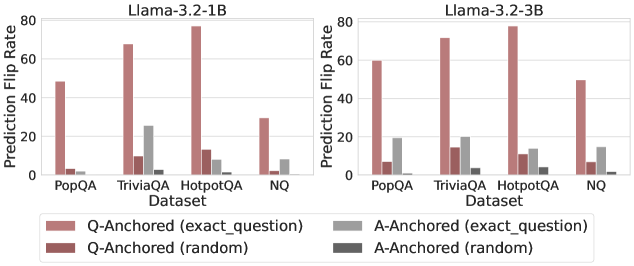
The image displays two side-by-side bar charts comparing the "Prediction Flip Rate" of two language models, Llama-3.2-1B and Llama-3.2-3B, across four question-answering datasets. The charts measure how often a model's prediction changes (flips) under different experimental conditions.
### Components/Axes
* **Chart Titles:** "Llama-3.2-1B" (left chart), "Llama-3.2-3B" (right chart).
* **Y-Axis:** Labeled "Prediction Flip Rate". Scale ranges from 0 to 80, with major tick marks at 0, 20, 40, 60, and 80.
* **X-Axis:** Labeled "Dataset". Four categorical datasets are listed: "PopQA", "TriviaQA", "HotpotQA", and "NQ".
* **Legend:** Positioned at the bottom center, spanning both charts. It defines four data series:
* **Pink Bar:** `Q-Anchored (exact_question)`
* **Dark Red Bar:** `Q-Anchored (random)`
* **Light Gray Bar:** `A-Anchored (exact_question)`
* **Dark Gray Bar:** `A-Anchored (random)`
### Detailed Analysis
**Llama-3.2-1B (Left Chart):**
* **PopQA:**
* `Q-Anchored (exact_question)`: ~50
* `Q-Anchored (random)`: ~5
* `A-Anchored (exact_question)`: ~3
* `A-Anchored (random)`: ~1
* **TriviaQA:**
* `Q-Anchored (exact_question)`: ~68
* `Q-Anchored (random)`: ~10
* `A-Anchored (exact_question)`: ~26
* `A-Anchored (random)`: ~3
* **HotpotQA:**
* `Q-Anchored (exact_question)`: ~78 (Highest value in this chart)
* `Q-Anchored (random)`: ~12
* `A-Anchored (exact_question)`: ~10
* `A-Anchored (random)`: ~5
* **NQ:**
* `Q-Anchored (exact_question)`: ~30
* `Q-Anchored (random)`: ~2
* `A-Anchored (exact_question)`: ~9
* `A-Anchored (random)`: ~1
**Llama-3.2-3B (Right Chart):**
* **PopQA:**
* `Q-Anchored (exact_question)`: ~60
* `Q-Anchored (random)`: ~7
* `A-Anchored (exact_question)`: ~19
* `A-Anchored (random)`: ~2
* **TriviaQA:**
* `Q-Anchored (exact_question)`: ~72
* `Q-Anchored (random)`: ~15
* `A-Anchored (exact_question)`: ~20
* `A-Anchored (random)`: ~4
* **HotpotQA:**
* `Q-Anchored (exact_question)`: ~79 (Highest value in this chart)
* `Q-Anchored (random)`: ~12
* `A-Anchored (exact_question)`: ~14
* `A-Anchored (random)`: ~6
* **NQ:**
* `Q-Anchored (exact_question)`: ~50
* `Q-Anchored (random)`: ~7
* `A-Anchored (exact_question)`: ~15
* `A-Anchored (random)`: ~1
### Key Observations
1. **Dominant Series:** The `Q-Anchored (exact_question)` condition (pink bars) consistently produces the highest prediction flip rate across all datasets and both models, often by a very large margin.
2. **Model Comparison:** The larger model (Llama-3.2-3B) generally shows higher flip rates for the `Q-Anchored (exact_question)` condition compared to the smaller model (1B), except for HotpotQA where they are nearly equal (~78 vs ~79).
3. **Dataset Sensitivity:** HotpotQA elicits the highest flip rates for the primary condition in both models. PopQA and NQ tend to have lower flip rates.
4. **Anchoring Effect:** "Q-Anchored" conditions (both exact and random) consistently result in higher flip rates than their "A-Anchored" counterparts.
5. **Random vs. Exact:** Within each anchoring type (Q or A), the "exact_question" variant leads to a significantly higher flip rate than the "random" variant.
### Interpretation
This data investigates the stability of model predictions when the input prompt is "anchored" to either the question (Q) or the answer (A). A high "Prediction Flip Rate" indicates that small changes to the prompt (like using an exact vs. random question) cause the model to change its output frequently, suggesting lower robustness.
The key finding is that **models are far more sensitive to variations in the question phrasing (`Q-Anchored`) than to variations related to the answer (`A-Anchored`)**. This sensitivity is dramatically amplified when the question is presented exactly as seen during training/evaluation (`exact_question`), as shown by the dominant pink bars. The trend suggests that the model's prediction is highly contingent on the precise lexical form of the question, more so than on the semantic content of the answer context. The larger model (3B) exhibits slightly more stability (lower flip rates) in some A-Anchored scenarios but is equally or more sensitive in the critical Q-Anchored (exact) scenario, indicating that increased scale does not necessarily mitigate this specific form of prompt sensitivity. The outlier is HotpotQA, which consistently causes the most prediction instability, possibly due to its multi-hop reasoning nature making models more fragile to prompt variations.