## Bar Chart: Prediction Flip Rate Comparison for Llama-3.2 Models
### Overview
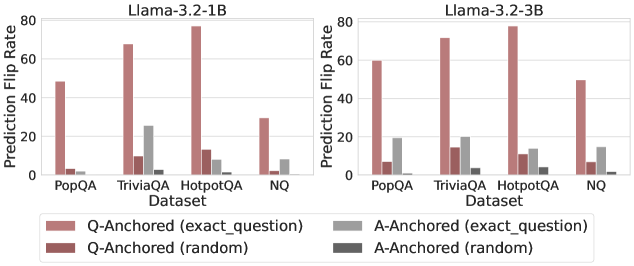
The image contains two side-by-side bar charts comparing prediction flip rates for Llama-3.2-1B and Llama-3.2-3B models across four datasets: PopQA, TriviaQA, HotpotQA, and NQ. Four bar colors represent different anchoring strategies: Q-Anchored (exact_question), Q-Anchored (random), A-Anchored (exact_question), and A-Anchored (random). The y-axis shows prediction flip rate percentages (0-80%), while the x-axis lists datasets.
### Components/Axes
- **X-axis (Datasets)**: PopQA, TriviaQA, HotpotQA, NQ (left to right)
- **Y-axis (Prediction Flip Rate)**: 0-80% in 20% increments
- **Legend (bottom)**:
- Pink: Q-Anchored (exact_question)
- Red: Q-Anchored (random)
- Gray: A-Anchored (exact_question)
- Black: A-Anchored (random)
### Detailed Analysis
#### Llama-3.2-1B Chart
- **PopQA**:
- Q-Anchored (exact_question): ~50% (pink)
- Q-Anchored (random): ~10% (red)
- A-Anchored (exact_question): ~25% (gray)
- A-Anchored (random): ~2% (black)
- **TriviaQA**:
- Q-Anchored (exact_question): ~65% (pink)
- Q-Anchored (random): ~12% (red)
- A-Anchored (exact_question): ~28% (gray)
- A-Anchored (random): ~3% (black)
- **HotpotQA**:
- Q-Anchored (exact_question): ~75% (pink)
- Q-Anchored (random): ~15% (red)
- A-Anchored (exact_question): ~10% (gray)
- A-Anchored (random): ~1% (black)
- **NQ**:
- Q-Anchored (exact_question): ~30% (pink)
- Q-Anchored (random): ~2% (red)
- A-Anchored (exact_question): ~8% (gray)
- A-Anchored (random): ~1% (black)
#### Llama-3.2-3B Chart
- **PopQA**:
- Q-Anchored (exact_question): ~60% (pink)
- Q-Anchored (random): ~15% (red)
- A-Anchored (exact_question): ~20% (gray)
- A-Anchored (random): ~3% (black)
- **TriviaQA**:
- Q-Anchored (exact_question): ~70% (pink)
- Q-Anchored (random): ~18% (red)
- A-Anchored (exact_question): ~22% (gray)
- A-Anchored (random): ~4% (black)
- **HotpotQA**:
- Q-Anchored (exact_question): ~78% (pink)
- Q-Anchored (random): ~20% (red)
- A-Anchored (exact_question): ~15% (gray)
- A-Anchored (random): ~5% (black)
- **NQ**:
- Q-Anchored (exact_question): ~50% (pink)
- Q-Anchored (random): ~8% (red)
- A-Anchored (exact_question): ~15% (gray)
- A-Anchored (random): ~2% (black)
### Key Observations
1. **Model Size Impact**: Llama-3.2-3B consistently shows higher prediction flip rates than Llama-3.2-1B across all datasets and anchoring strategies.
2. **Anchoring Strategy Trends**:
- Q-Anchored (exact_question) dominates with the highest flip rates (50-78%).
- Q-Anchored (random) shows moderate rates (2-20%).
- A-Anchored strategies have the lowest rates (1-28%).
3. **Dataset Variance**:
- HotpotQA has the highest flip rates for Q-Anchored (exact_question) in both models.
- NQ has the lowest flip rates across all strategies.
### Interpretation
The data suggests that:
- Larger model size (3B vs 1B) improves prediction flip rates across all anchoring strategies.
- Q-Anchored (exact_question) is the most effective strategy, likely due to precise question alignment with context.
- Random anchoring (both Q and A) performs poorly, indicating that random context selection reduces model confidence.
- The NQ dataset (Natural Questions) shows the weakest performance, possibly due to its open-ended nature requiring deeper reasoning.
The charts highlight the importance of question-specific anchoring for improving model reliability, with model scale amplifying these effects. The consistent underperformance of random anchoring strategies suggests that context selection significantly impacts prediction stability.