## Flowchart: Hierarchical Process Structure
### Overview
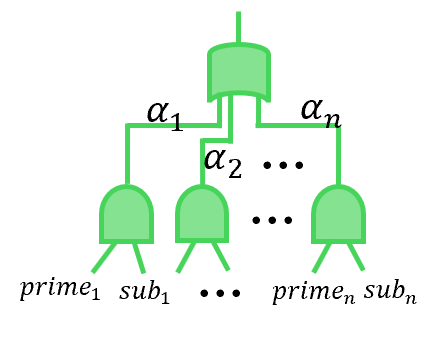
The image depicts a hierarchical flowchart with a central cylindrical component labeled "α" at the top, branching into multiple pathways. Each pathway connects to an oval component labeled "α₁", "α₂", ..., "αₙ", which further branch into terminal nodes labeled "prime₁", "sub₁", ..., "primeₙ", "subₙ". Arrows indicate directional flow from the central component to terminal nodes.
### Components/Axes
- **Central Component**: Cylinder labeled "α" (top-center).
- **Intermediate Components**: Ovals labeled "α₁", "α₂", ..., "αₙ" (arranged horizontally below the central cylinder).
- **Terminal Nodes**: Pairs of labels "prime₁", "sub₁"; "prime₂", "sub₂"; ...; "primeₙ", "subₙ" (connected to ovals via arrows).
- **Flow Direction**: Top-to-bottom, with branching from the central cylinder to ovals, then to terminal nodes.
### Detailed Analysis
- **Central Cylinder ("α")**: Positioned at the top-center, acting as the root node. No additional labels or annotations.
- **Intermediate Ovals ("α₁" to "αₙ")**:
- Labeled sequentially from left to right.
- Connected to the central cylinder via arrows.
- Each oval branches into two terminal nodes ("prime" and "sub").
- **Terminal Nodes ("prime₁", "sub₁", ..., "primeₙ", "subₙ")**:
- Positioned directly below their respective ovals.
- Labeled with subscripts (1 to n) to denote sequential or parallel instances.
- Arrows connect ovals to terminal nodes, indicating dependency or output relationships.
### Key Observations
1. **Hierarchical Structure**: The flowchart represents a top-down process where the central component "α" distributes functionality to intermediate components ("α₁" to "αₙ"), which in turn manage specific "prime" and "sub" pairs.
2. **Scalability**: The use of ellipses (...) suggests the structure can extend indefinitely (e.g., "α₃", "prime₃", "sub₃" would follow the pattern).
3. **Symmetry**: Each oval has an identical two-node output structure ("prime" and "sub"), implying uniform processing logic across branches.
### Interpretation
The diagram likely models a system where a central process ("α") delegates tasks to specialized sub-components ("α₁" to "αₙ"), each responsible for handling a unique pair of elements ("prime" and "sub"). This could represent:
- **Modular Architecture**: In software or engineering systems, where a core module ("α") interfaces with specialized modules ("α₁" to "αₙ") to manage distinct subsystems ("prime" and "sub").
- **Data Flow**: A central data processor ("α") routes information to specialized handlers ("α₁" to "αₙ"), which process specific data pairs ("prime" and "sub").
- **Resource Allocation**: A central resource ("α") allocates tasks to sub-teams ("α₁" to "αₙ"), each managing distinct resources ("prime" and "sub").
The absence of numerical values or quantitative metrics suggests the flowchart emphasizes **logical relationships** rather than performance data. The use of "prime" and "sub" may imply hierarchical prioritization (e.g., primary vs. secondary roles) or complementary functions within each branch.