## Diagram: Hierarchical Aggregation Network
### Overview
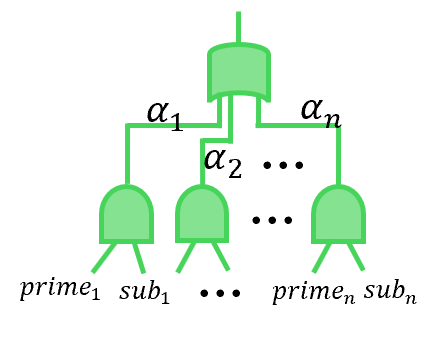
The image displays a schematic diagram of a hierarchical network structure, likely representing a computational or logical model. It features a tree-like architecture with a single top-level node connected to multiple lower-level nodes. The diagram uses a consistent visual language with green shapes representing processing units or gates, black lines for connections, and mathematical notation for labels.
### Components/Axes
* **Primary Components:** The diagram consists of two tiers of identical green shapes resembling logic gates or processing units (specifically, they look like AND gates or similar computational blocks).
* **Top Tier:** A single gate positioned at the top-center of the diagram.
* **Bottom Tier:** A horizontal row of gates. The diagram explicitly shows three gates (left, center, right) with ellipses (`...`) between the center and right gates, indicating a sequence that continues to an arbitrary number `n`.
* **Connections:** Black lines connect the top gate to each gate in the bottom tier. Each connection is labeled with a Greek letter alpha (`α`) with a subscript.
* **Labels & Text:**
* **Connection Labels:** `α₁`, `α₂`, `αₙ`. These are placed adjacent to the lines connecting the top gate to the corresponding bottom-tier gates.
* **Input Labels:** Below each bottom-tier gate, there are paired labels: `prime₁ sub₁` (under the leftmost gate), `primeₙ subₙ` (under the rightmost gate). Ellipses (`...`) are placed between the center and right gates in this row as well.
* **Ellipses (`...`):** Used in two locations to denote repetition: between the `α₂` and `αₙ` connection labels, and between the `prime₁ sub₁` and `primeₙ subₙ` input labels.
### Detailed Analysis
* **Structure & Flow:** The flow is hierarchical and bottom-up. Multiple parallel processes or data streams (represented by the bottom-tier gates) feed into a single, higher-level aggregation or processing unit (the top gate).
* **Component Isolation:**
* **Header Region:** Contains the single top gate and the initial segments of its outgoing connections.
* **Main Chart Region:** Contains the row of bottom-tier gates, their input labels, and the labeled connection lines.
* **Footer Region:** Contains the input labels (`prime₁ sub₁`, etc.) positioned directly below their respective gates.
* **Spatial Grounding:**
* The top gate is **centered at the top**.
* The bottom-tier gates are arranged in a **horizontal row across the lower half** of the diagram.
* The label `α₁` is positioned **top-left relative to the center**, next to the leftmost connection line.
* The label `αₙ` is positioned **top-right relative to the center**, next to the rightmost connection line.
* The input label `prime₁ sub₁` is at the **bottom-left**, and `primeₙ subₙ` is at the **bottom-right**.
* **Trend Verification:** The diagram does not depict numerical trends but a structural relationship. The visual trend is one of **convergence**: multiple distinct inputs (`prime_i sub_i`) are processed locally and then their outputs (weighted or transformed by `α_i`) are combined at a central node.
### Key Observations
1. **Generalized Model:** The use of subscripts `1` and `n` with ellipses indicates this is a generalized schematic for a system with an arbitrary number (`n`) of parallel components.
2. **Paired Inputs:** Each bottom-tier gate receives a distinct pair of inputs labeled `prime_i` and `sub_i`. This suggests a two-factor input for each parallel process.
3. **Weighting/Parameterization:** The labels `α₁`, `α₂`, `αₙ` on the connection lines strongly imply that each parallel stream's contribution to the top node is modulated by a parameter `α`. These could be weights, coefficients, or probabilities.
4. **Uniformity:** All gates (top and bottom) are visually identical, suggesting they perform the same fundamental operation, though their role in the hierarchy differs.
### Interpretation
This diagram illustrates a **weighted aggregation or fusion architecture**. It is a common pattern in fields like:
* **Machine Learning:** An ensemble method where predictions from `n` base models (`prime_i sub_i` could represent model i's prediction on sub-problem i) are combined using weights `α_i` to produce a final output.
* **Signal Processing:** A system combining `n` sensor signals, each processed (`prime_i sub_i`) and then weighted (`α_i`) before fusion.
* **Logical/Distributed Systems:** A decision-making process where `n` sub-conclusions or votes are aggregated with different levels of influence (`α_i`).
The **Peircean investigative** reading suggests this is an **iconic diagram**—it represents the system's structure through spatial analogy. The **underlying information** is the principle of **parallel processing with weighted integration**. The model's power and flexibility come from the parameters `α_i`, which determine the relative importance of each parallel branch. The absence of specific numerical values or a defined operation for the gates means this is a conceptual template, not a specific instance. To make it actionable, one would need to define the function of the gates (e.g., summation, multiplication, a neural network layer) and the values of the `α` parameters and `prime/sub` inputs.