# Receiver Operating Characteristic Curve (Training) Analysis
## Chart Description
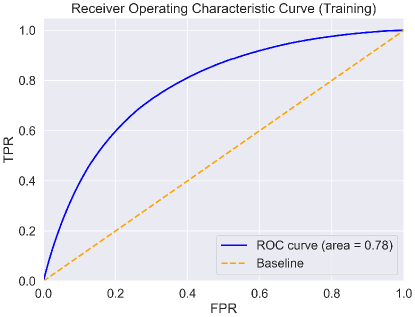
The image depicts a **Receiver Operating Characteristic (ROC) curve** used to evaluate the performance of a classification model during training. The chart visualizes the trade-off between the **True Positive Rate (TPR)** and **False Positive Rate (FPR)** across varying classification thresholds.
---
## Key Components
### Axes
- **X-axis (FPR)**: False Positive Rate, ranging from 0.0 to 1.0.
- **Y-axis (TPR)**: True Positive Rate, ranging from 0.0 to 1.0.
### Lines
1. **ROC Curve** (solid blue line):
- Starts at (0.0, 0.0).
- Rises steeply initially, then curves gradually toward (1.0, 1.0).
- Area under the curve (AUC) = **0.78** (as annotated in the legend).
2. **Baseline** (dashed orange line):
- Straight diagonal line from (0.0, 0.0) to (1.0, 1.0).
- Represents a random classifier with AUC = 0.5.
---
## Legend
- **Location**: Bottom-right corner of the chart.
- **Entries**:
- **ROC curve**: Solid blue line (AUC = 0.78).
- **Baseline**: Dashed orange line.
---
## Spatial Grounding
- **Legend Position**: [x: 0.85, y: 0.15] (relative to chart boundaries).
- **Color Consistency**:
- ROC curve (blue) matches legend entry.
- Baseline (orange) matches legend entry.
---
## Trend Verification
1. **ROC Curve**:
- **Visual Trend**: Starts at the origin, ascends sharply, then flattens as it approaches the top-right corner. The curve’s concavity indicates a non-linear relationship between TPR and FPR.
- **Data Points**:
- At FPR = 0.2, TPR ≈ 0.6.
- At FPR = 0.4, TPR ≈ 0.8.
- At FPR = 0.6, TPR ≈ 0.9.
- At FPR = 0.8, TPR ≈ 0.95.
- At FPR = 1.0, TPR = 1.0.
2. **Baseline**:
- **Visual Trend**: Linear increase with a slope of 1.0 (45° angle).
- **Data Points**:
- At FPR = 0.2, TPR = 0.2.
- At FPR = 0.4, TPR = 0.4.
- At FPR = 0.6, TPR = 0.6.
- At FPR = 0.8, TPR = 0.8.
- At FPR = 1.0, TPR = 1.0.
---
## Technical Notes
- The ROC curve’s AUC of **0.78** suggests moderate model performance. A perfect classifier would have an AUC of 1.0, while random guessing yields 0.5.
- The baseline serves as a reference for evaluating the ROC curve’s effectiveness.
---
## Conclusion
The chart demonstrates that the trained model outperforms a random classifier, with the ROC curve consistently above the baseline. The AUC value quantifies this performance, providing a single metric for comparison across different models or thresholds.