# Technical Document Extraction: Receiver Operating Characteristic (ROC) Curve
## 1. Document Metadata
* **Title:** Receiver Operating Characteristic Curve (Training)
* **Type:** Statistical Chart / Performance Metric Plot
* **Language:** English
## 2. Component Isolation
### Header
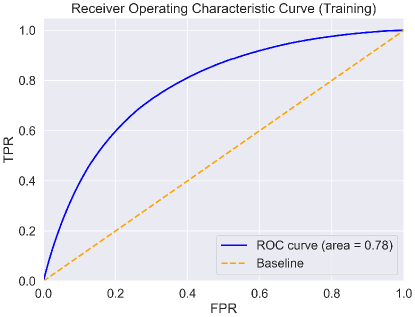
* **Text:** "Receiver Operating Characteristic Curve (Training)"
* **Position:** Top center.
### Main Chart Area
* **X-Axis Label:** "FPR" (False Positive Rate)
* **Y-Axis Label:** "TPR" (True Positive Rate)
* **X-Axis Scale:** 0.0 to 1.0 (increments of 0.2 marked: 0.0, 0.2, 0.4, 0.6, 0.8, 1.0)
* **Y-Axis Scale:** 0.0 to 1.0 (increments of 0.2 marked: 0.0, 0.2, 0.4, 0.6, 0.8, 1.0)
* **Grid:** Light gray horizontal and vertical grid lines corresponding to the 0.2 increments.
* **Background:** Light lavender/gray shaded area.
### Legend
* **Spatial Placement:** Bottom-right quadrant (approximate [x=0.6, y=0.1] in normalized coordinates).
* **Entry 1:** Solid dark blue line — "ROC curve (area = 0.78)"
* **Entry 2:** Dashed orange line — "Baseline"
---
## 3. Data Series Analysis and Trend Verification
### Series 1: ROC Curve
* **Color/Style:** Solid dark blue line.
* **Visual Trend:** The line starts at the origin (0,0) and exhibits a steep upward slope initially. As the FPR increases, the slope gradually decreases (concave down), eventually terminating at the top-right corner (1,1). The curve stays consistently above the baseline.
* **Key Data Points (Estimated):**
| FPR | TPR |
| :--- | :--- |
| 0.0 | 0.0 |
| 0.1 | 0.4 |
| 0.2 | 0.6 |
| 0.4 | 0.8 |
| 0.6 | 0.9 |
| 0.8 | 0.96 |
| 1.0 | 1.0 |
* **Metric:** Area Under the Curve (AUC) = 0.78.
### Series 2: Baseline
* **Color/Style:** Dashed orange line.
* **Visual Trend:** A perfectly linear diagonal line sloping upward at a 45-degree angle from the origin (0,0) to the maximum point (1,1).
* **Significance:** Represents a random classifier (AUC = 0.50).
---
## 4. Summary of Information
This chart visualizes the performance of a binary classification model on a training dataset.
* **Performance:** The model performs significantly better than a random guess, as indicated by the blue ROC curve bowing toward the top-left corner of the plot.
* **Discriminative Power:** With an Area Under the Curve (AUC) of **0.78**, the model has a "fair" to "good" ability to distinguish between the positive and negative classes.
* **Trade-off:** At a False Positive Rate (FPR) of 0.2, the model achieves a True Positive Rate (TPR) of approximately 0.6. To reach a TPR of 0.8, the model must accept an FPR of approximately 0.4.