## Line Graph: Accuracy vs. Sample Size (k)
### Overview
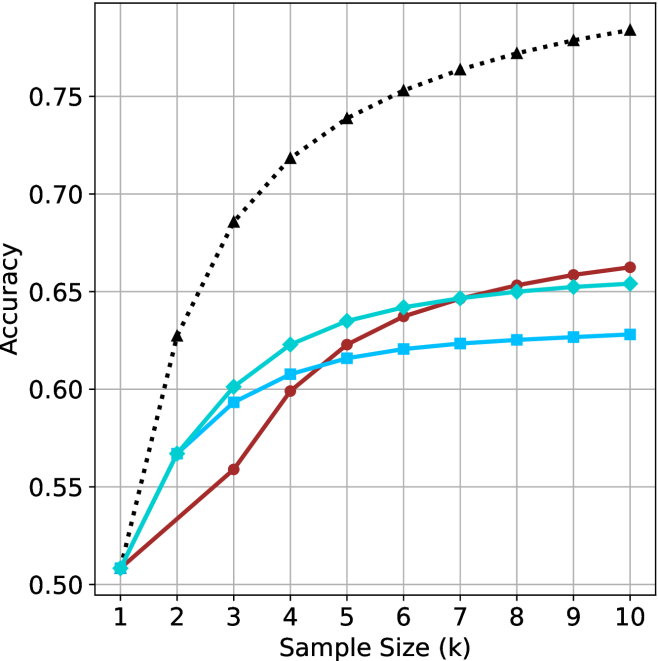
The image depicts a line graph comparing the accuracy of three models (A, B, C) and a baseline across sample sizes (k = 1 to 10). Accuracy ranges from 0.50 to 0.75 on the y-axis, with sample size increments of 1 on the x-axis. Three solid lines (red, blue, green) represent model performance, while a dotted black line represents the baseline.
### Components/Axes
- **X-axis**: "Sample Size (k)" with integer ticks (1–10).
- **Y-axis**: "Accuracy" with increments of 0.05 (0.50–0.75).
- **Legend**: Located in the top-right corner, associating:
- Red line (▲): Model A
- Blue line (■): Model B
- Green line (●): Model C
- Dotted black line (▲): Baseline
### Detailed Analysis
1. **Model A (Red, ▲)**:
- Starts at 0.50 (k=1).
- Increases steadily to ~0.66 at k=10.
- Slope: Linear upward trend with no plateau.
2. **Model B (Blue, ■)**:
- Starts at 0.50 (k=1).
- Rises to ~0.62 at k=5, then plateaus.
- Slope: Steeper initial increase, flattening after k=5.
3. **Model C (Green, ●)**:
- Starts at 0.50 (k=1).
- Reaches ~0.65 at k=5, then plateaus.
- Slope: Moderate initial increase, flattening after k=5.
4. **Baseline (Dotted Black, ▲)**:
- Starts at 0.50 (k=1).
- Curves upward, reaching ~0.75 at k=10.
- Slope: Non-linear, accelerating growth.
### Key Observations
- All models begin at the same baseline accuracy (0.50) but diverge as sample size increases.
- Model A outperforms Models B and C consistently across all sample sizes.
- Models B and C plateau at ~0.62 and ~0.65, respectively, suggesting diminishing returns beyond k=5.
- The baseline’s dotted line exceeds all models, indicating theoretical maximum accuracy not achieved by any model.
### Interpretation
The data demonstrates that increasing sample size improves model accuracy, but gains diminish after k=5 for Models B and C. Model A’s linear improvement suggests superior scalability. The baseline’s trajectory implies an upper limit for accuracy, which no model reaches. This could reflect inherent data complexity or model limitations. The plateauing of Models B and C highlights the importance of selecting models with sustained improvement potential for large-scale applications.