# Technical Document Extraction: ALFWorld Success Rate Chart
## 1. Header Information
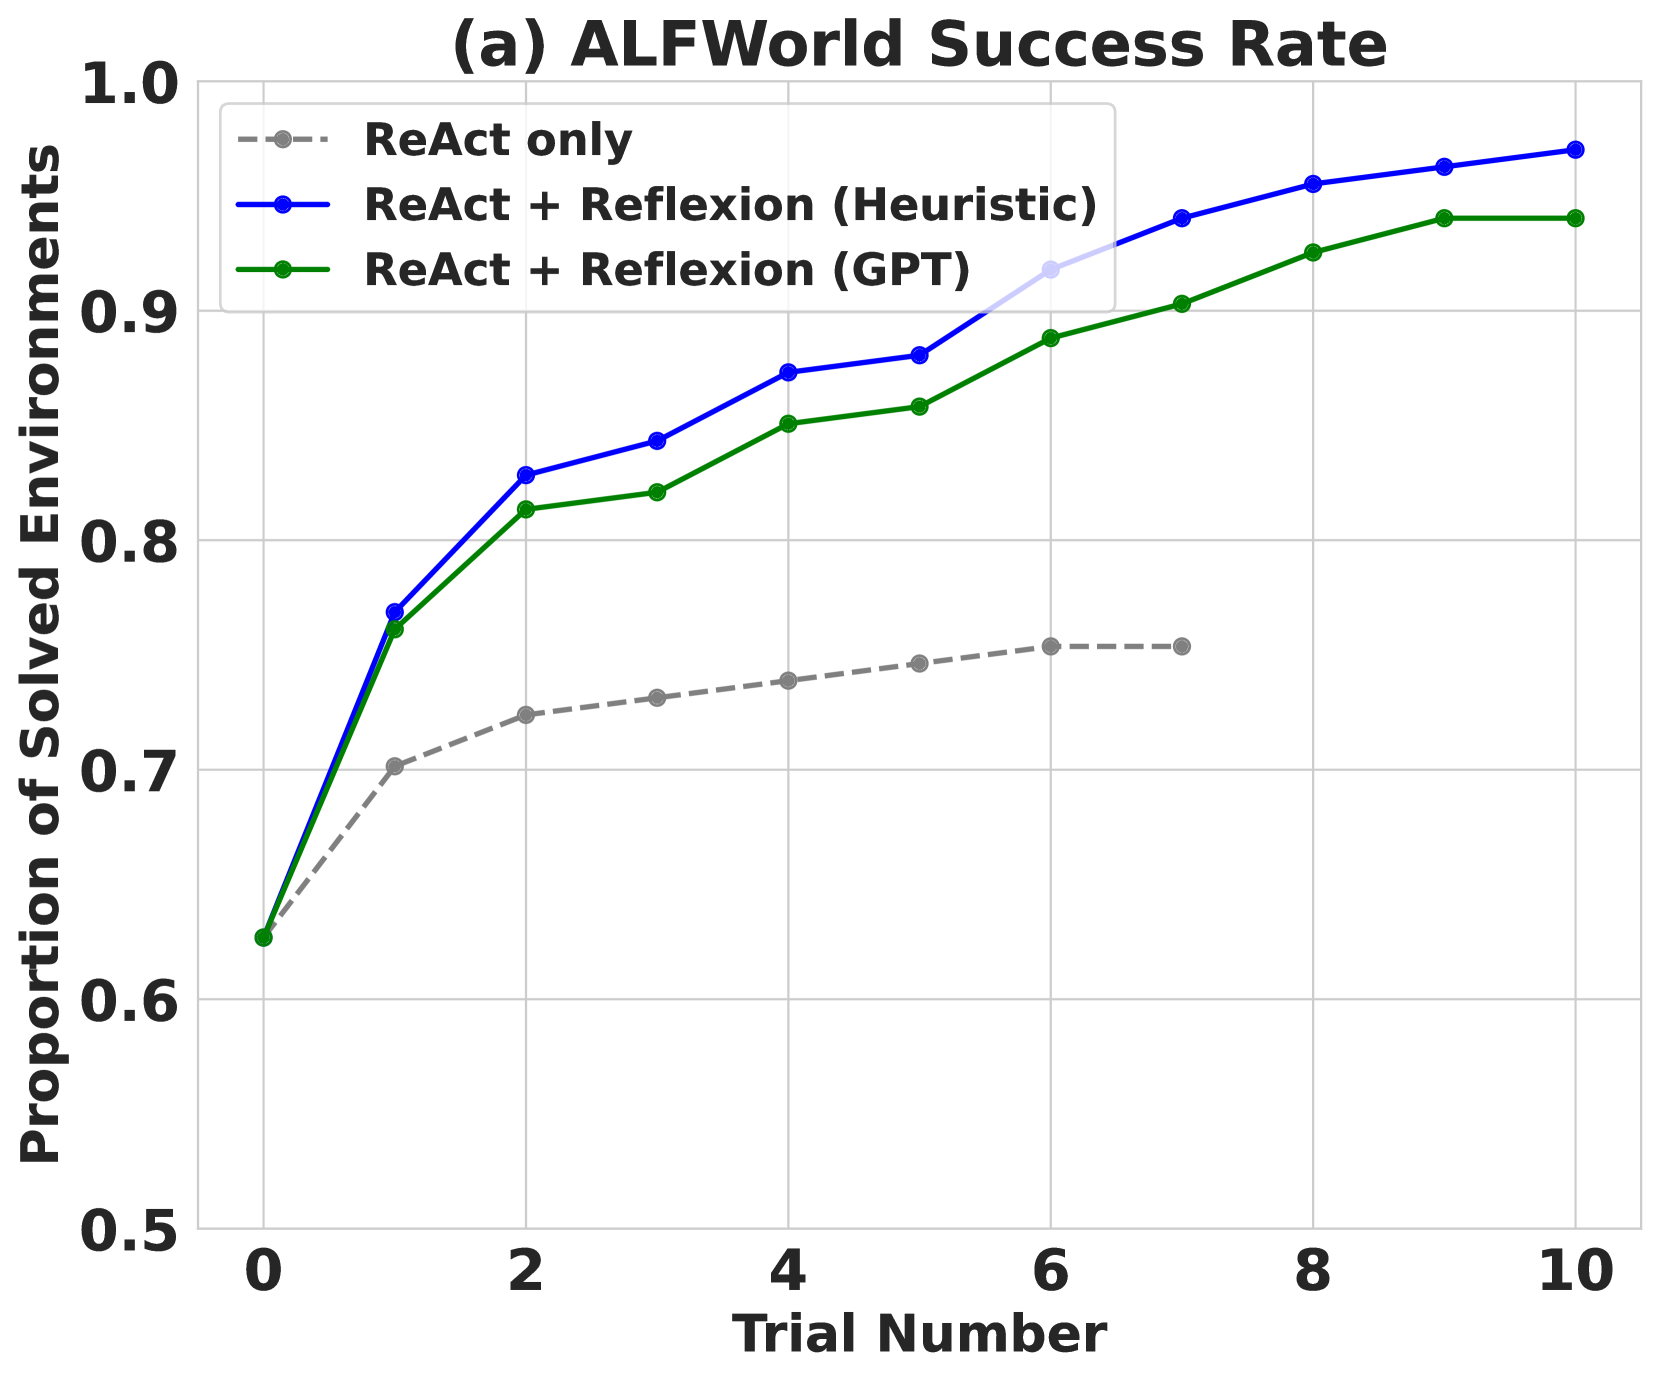
* **Title:** (a) ALFWorld Success Rate
## 2. Axis Definitions
* **Y-Axis Label:** Proportion of Solved Environments
* **Y-Axis Scale:** 0.5 to 1.0 (increments of 0.1 marked, with grid lines every 0.05)
* **X-Axis Label:** Trial Number
* **X-Axis Scale:** 0 to 10 (increments of 2 marked: 0, 2, 4, 6, 8, 10)
## 3. Legend Information
The legend is located in the upper-left quadrant of the chart area.
* **ReAct only:** Grey dashed line with circular markers.
* **ReAct + Reflexion (Heuristic):** Blue solid line with circular markers.
* **ReAct + Reflexion (GPT):** Green solid line with circular markers.
## 4. Data Series Analysis and Trends
### Series 1: ReAct only (Grey Dashed Line)
* **Visual Trend:** Shows an initial sharp increase from Trial 0 to Trial 1, followed by a very shallow upward slope that plateaus. This series terminates early at Trial 7.
* **Data Points (Approximate):**
* Trial 0: ~0.63
* Trial 1: ~0.70
* Trial 2: ~0.72
* Trial 3: ~0.73
* Trial 4: ~0.74
* Trial 5: ~0.75
* Trial 6: ~0.755
* Trial 7: ~0.755
### Series 2: ReAct + Reflexion (Heuristic) (Blue Solid Line)
* **Visual Trend:** This is the highest-performing series. It shows a steep upward trajectory from Trial 0 to Trial 2, followed by a consistent, steady climb toward a near-perfect success rate by Trial 10.
* **Data Points (Approximate):**
* Trial 0: ~0.63
* Trial 1: ~0.77
* Trial 2: ~0.83
* Trial 3: ~0.845
* Trial 4: ~0.875
* Trial 5: ~0.88
* Trial 6: ~0.92
* Trial 7: ~0.94
* Trial 8: ~0.955
* Trial 9: ~0.965
* Trial 10: ~0.97
### Series 3: ReAct + Reflexion (GPT) (Green Solid Line)
* **Visual Trend:** Follows a similar trajectory to the Heuristic version but consistently sits slightly lower (approx. 0.02 to 0.03 points lower). It shows steady improvement across all 10 trials.
* **Data Points (Approximate):**
* Trial 0: ~0.63
* Trial 1: ~0.76
* Trial 2: ~0.815
* Trial 3: ~0.82
* Trial 4: ~0.85
* Trial 5: ~0.86
* Trial 6: ~0.89
* Trial 7: ~0.905
* Trial 8: ~0.925
* Trial 9: ~0.94
* Trial 10: ~0.94
## 5. Key Observations
* **Baseline:** All three methods start at the exact same success rate (~0.63) at Trial 0.
* **Reflexion Impact:** Both "Reflexion" variants significantly outperform the "ReAct only" baseline. By Trial 7, the Reflexion methods are approximately 15-18% more successful than the baseline.
* **Heuristic vs. GPT:** The Heuristic-based Reflexion consistently maintains a small performance lead over the GPT-based Reflexion throughout the duration of the experiment.
* **Saturation:** The "ReAct only" method appears to reach its performance ceiling much earlier (around Trial 6) compared to the Reflexion methods, which continue to improve through Trial 10.