# Technical Document Extraction: Performance Metrics vs. Number of Data Providers
## Graph 1: Time (s)
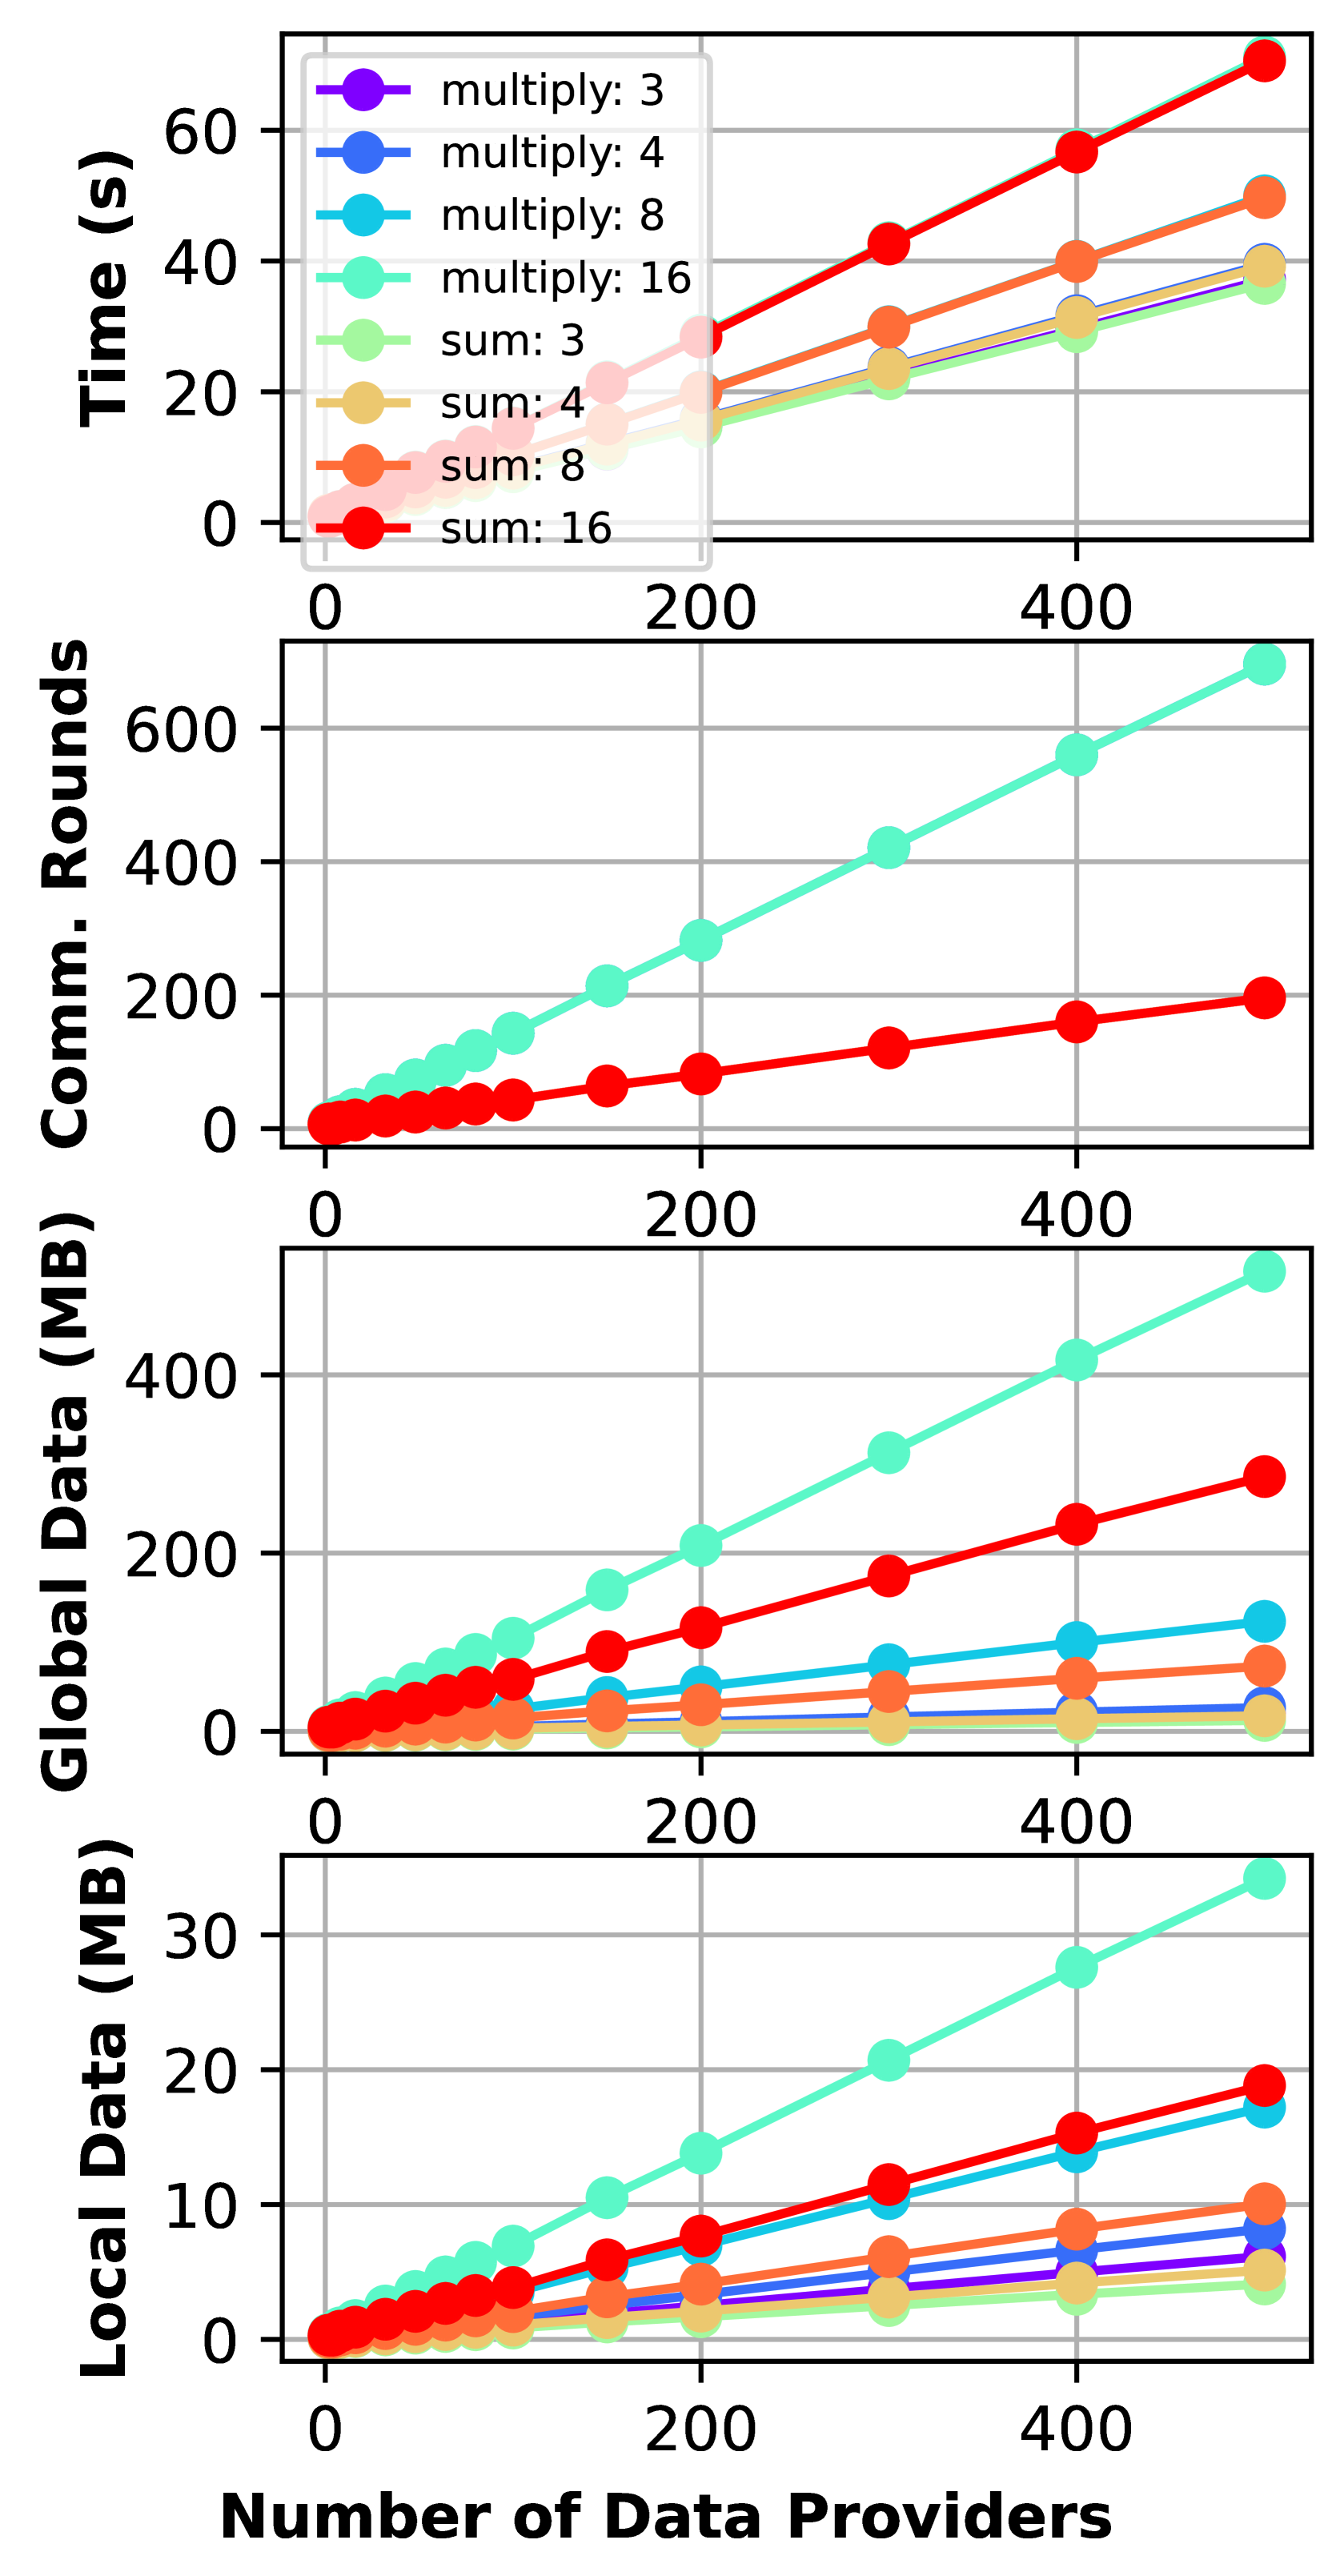
- **X-axis**: Number of Data Providers (0–400)
- **Y-axis**: Time (seconds)
- **Legend**:
- `multiply:3` (purple)
- `multiply:4` (blue)
- `multiply:8` (cyan)
- `multiply:16` (teal)
- `sum:3` (green)
- `sum:4` (orange)
- `sum:8` (red-orange)
- `sum:16` (red)
- **Key Trends**:
- `sum:16` (red) exhibits the steepest growth, reaching ~60s at 400 providers.
- `multiply:16` (teal) follows closely, peaking at ~50s.
- Lower multipliers (e.g., `sum:3`, `multiply:3`) show minimal growth, staying below 20s.
## Graph 2: Comm. Rounds
- **X-axis**: Number of Data Providers (0–400)
- **Y-axis**: Communication Rounds
- **Legend**: Same as Graph 1.
- **Key Trends**:
- `multiply:16` (teal) dominates, reaching ~600 rounds at 400 providers.
- `sum:16` (red) is second, peaking at ~200 rounds.
- Lower multipliers (e.g., `sum:3`, `multiply:3`) remain below 100 rounds.
## Graph 3: Global Data (MB)
- **X-axis**: Number of Data Providers (0–400)
- **Y-axis**: Global Data (MB)
- **Legend**: Same as Graph 1.
- **Key Trends**:
- `multiply:16` (teal) grows fastest, exceeding 400 MB at 400 providers.
- `sum:16` (red) follows, reaching ~250 MB.
- Lower multipliers (e.g., `sum:3`, `multiply:3`) stay below 50 MB.
## Graph 4: Local Data (MB)
- **X-axis**: Number of Data Providers (0–400)
- **Y-axis**: Local Data (MB)
- **Legend**: Same as Graph 1.
- **Key Trends**:
- `multiply:16` (teal) leads, surpassing 30 MB at 400 providers.
- `sum:16` (red) is second, peaking at ~20 MB.
- Lower multipliers (e.g., `sum:3`, `multiply:3`) remain below 10 MB.
## Cross-Graph Observations
1. **Scalability**: All metrics (time, communication rounds, data) increase with the number of providers.
2. **Operation Impact**:
- `sum` operations generally outperform `multiply` for the same multiplier (e.g., `sum:16` > `multiply:16` in time and data).
- Higher multipliers (e.g., 16 vs. 3) consistently degrade performance across all metrics.
3. **Legend Consistency**: Colors and labels align perfectly across all graphs, confirming uniform categorization.