## Chart/Diagram Type: Multi-Panel Figure
### Overview
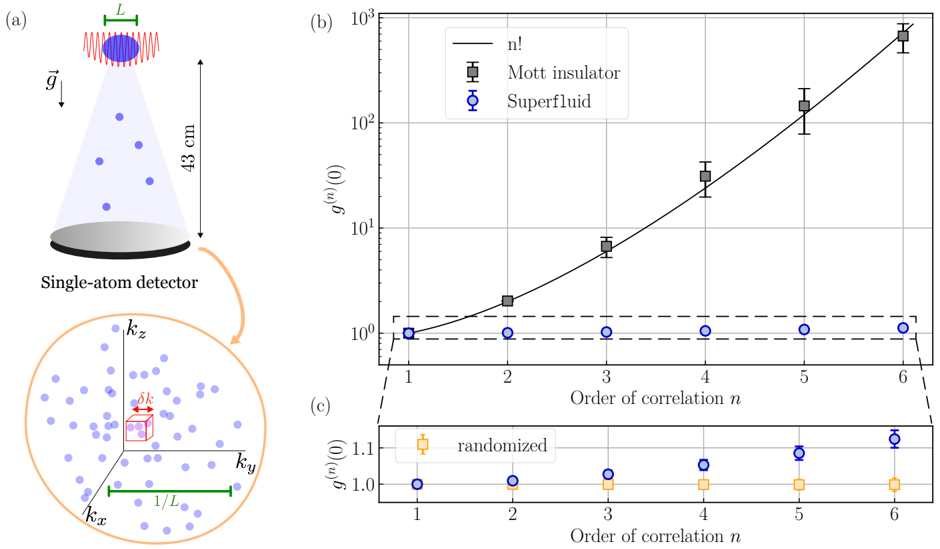
The image consists of three panels: (a) a schematic diagram of an experimental setup, (b) a log-linear plot showing the correlation function g^(n)(0) versus the order of correlation n for Mott insulator and Superfluid states, and (c) a linear plot showing the correlation function g^(n)(0) versus the order of correlation n for randomized and Superfluid states.
### Components/Axes
**Panel (a): Schematic Diagram**
* A cloud of atoms is illuminated by a laser (indicated by red sinusoidal waves).
* The length of the cloud is labeled as "L" (green).
* The direction of gravity is indicated by "g" with an arrow pointing downwards.
* The distance between the cloud and the single-atom detector is labeled as "43 cm".
* Below the detector, a magnified view shows the momentum space with axes kx, ky, and kz.
* A small cube with side length "δk" is shown in the momentum space.
* The length 1/L is indicated on the kx axis.
**Panel (b): Log-Linear Plot**
* Y-axis: g^(n)(0) (logarithmic scale from 10^0 to 10^3)
* X-axis: Order of correlation n (linear scale from 1 to 6)
* Legend (top-right):
* Black line: n!
* Gray squares with error bars: Mott insulator
* Blue circles with error bars: Superfluid
**Panel (c): Linear Plot**
* Y-axis: g^(n)(0) (linear scale from 1.0 to 1.1)
* X-axis: Order of correlation n (linear scale from 1 to 6)
* Legend (top-right):
* Yellow squares with error bars: randomized
* Blue circles with error bars: Superfluid
### Detailed Analysis or Content Details
**Panel (b): Log-Linear Plot**
* **n! (Black Line):** The black line represents the factorial of n. It increases exponentially with n.
* n=1: g^(n)(0) ≈ 1
* n=2: g^(n)(0) ≈ 2
* n=3: g^(n)(0) ≈ 6
* n=4: g^(n)(0) ≈ 24
* n=5: g^(n)(0) ≈ 120
* n=6: g^(n)(0) ≈ 720
* **Mott insulator (Gray Squares):** The Mott insulator data points increase exponentially with n, closely following the n! curve.
* n=1: g^(n)(0) ≈ 1.0 +/- 0.2
* n=2: g^(n)(0) ≈ 2.0 +/- 0.5
* n=3: g^(n)(0) ≈ 7.0 +/- 2.0
* n=4: g^(n)(0) ≈ 25 +/- 5
* n=5: g^(n)(0) ≈ 120 +/- 30
* n=6: g^(n)(0) ≈ 750 +/- 150
* **Superfluid (Blue Circles):** The Superfluid data points remain approximately constant at g^(n)(0) ≈ 1.0 for all values of n.
* n=1: g^(n)(0) ≈ 1.0 +/- 0.1
* n=2: g^(n)(0) ≈ 1.0 +/- 0.1
* n=3: g^(n)(0) ≈ 1.0 +/- 0.1
* n=4: g^(n)(0) ≈ 1.0 +/- 0.1
* n=5: g^(n)(0) ≈ 1.0 +/- 0.1
* n=6: g^(n)(0) ≈ 1.0 +/- 0.1
**Panel (c): Linear Plot**
* **randomized (Yellow Squares):** The randomized data points remain approximately constant at g^(n)(0) ≈ 1.0 for all values of n.
* n=1: g^(n)(0) ≈ 1.0 +/- 0.02
* n=2: g^(n)(0) ≈ 1.0 +/- 0.02
* n=3: g^(n)(0) ≈ 1.0 +/- 0.02
* n=4: g^(n)(0) ≈ 1.0 +/- 0.02
* n=5: g^(n)(0) ≈ 1.0 +/- 0.02
* n=6: g^(n)(0) ≈ 1.1 +/- 0.02
* **Superfluid (Blue Circles):** The Superfluid data points remain approximately constant at g^(n)(0) ≈ 1.0 for all values of n.
* n=1: g^(n)(0) ≈ 1.0 +/- 0.02
* n=2: g^(n)(0) ≈ 1.0 +/- 0.02
* n=3: g^(n)(0) ≈ 1.0 +/- 0.02
* n=4: g^(n)(0) ≈ 1.0 +/- 0.02
* n=5: g^(n)(0) ≈ 1.0 +/- 0.02
* n=6: g^(n)(0) ≈ 1.1 +/- 0.02
### Key Observations
* In panel (b), the Mott insulator exhibits factorial scaling of the correlation function with the order of correlation, while the Superfluid remains constant.
* In panel (c), both the randomized and Superfluid states exhibit correlation functions close to 1.0.
* The error bars are relatively small for the Superfluid and randomized data in panel (c), indicating high precision.
* The error bars for the Mott insulator in panel (b) increase with the order of correlation.
### Interpretation
The data suggests that the Mott insulator exhibits strong, high-order correlations, as indicated by the factorial scaling of g^(n)(0). This is a characteristic feature of Mott insulators, where particle number fluctuations are suppressed. In contrast, the Superfluid state exhibits weak correlations, with g^(n)(0) remaining close to 1.0, indicating Poissonian statistics. The randomized data in panel (c) also shows weak correlations, similar to the Superfluid. The experimental setup in panel (a) likely involves trapping atoms and measuring their correlations using a single-atom detector. The momentum space representation shows the distribution of atoms in k-space, with δk representing the momentum resolution. The length scale L is related to the size of the atomic cloud.