## [Diagram/Chart]: Experimental Setup and Correlation Measurements
### Overview
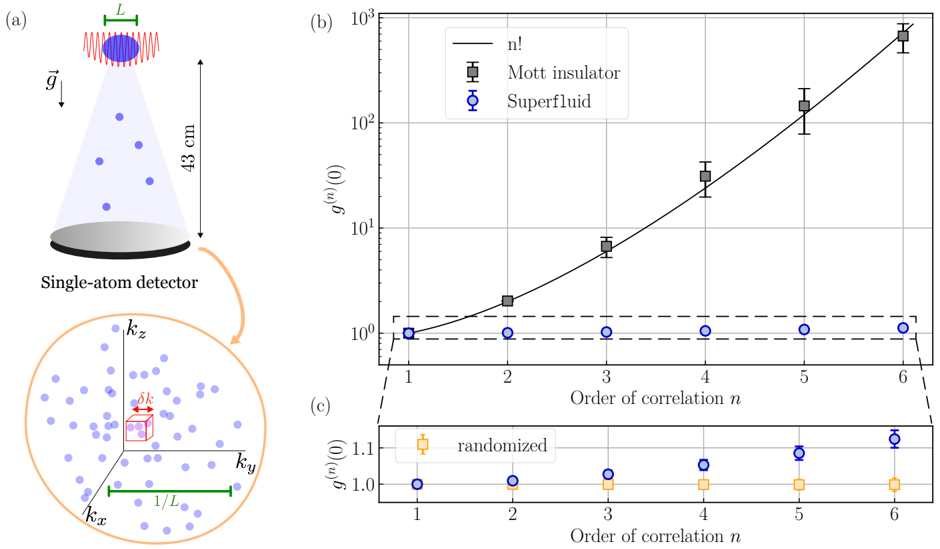
This image presents a scientific figure composed of three parts:
* **(a)** A schematic diagram illustrating a time-of-flight experimental setup for measuring atom correlations.
* **(b)** A log-linear plot displaying the $n$-th order correlation function $g^{(n)}(0)$ versus the order of correlation $n$ for two states: "Mott insulator" and "Superfluid".
* **(c)** A linear-scale zoomed-in plot focusing on the lower values of $g^{(n)}(0)$ for the "Superfluid" and a "randomized" control dataset.
### Components/Axes
**Panel (a): Schematic**
* **Top:** A blue oval representing an atomic cloud with a characteristic length $L$.
* **Middle:** A cone of blue dots (atoms) falling under gravity $\vec{g}$ over a distance of 43 cm.
* **Bottom:** A "Single-atom detector" (gray disk).
* **Inset (Bottom Left):** A circular expansion showing a 3D coordinate system ($k_x, k_y, k_z$) in momentum space. It features a red cube of volume $\delta k$ and a green scale bar labeled $1/L$.
**Panel (b): Correlation Plot**
* **Y-axis:** $g^{(n)}(0)$ (Logarithmic scale, ranging from $10^0$ to $10^3$).
* **X-axis:** "Order of correlation $n$" (Linear scale, 1 to 6).
* **Legend:**
* Solid black line: $n!$ (factorial of $n$).
* Gray squares: "Mott insulator".
* Blue circles: "Superfluid".
* **Annotation:** A dashed rectangle highlights the region between $y=1$ and $y \approx 1.2$ for $n=1$ to $6$, which corresponds to the zoomed-in view in panel (c).
**Panel (c): Zoomed-in Correlation Plot**
* **Y-axis:** $g^{(n)}(0)$ (Linear scale, ranging from 1.0 to 1.15).
* **X-axis:** "Order of correlation $n$" (Linear scale, 1 to 6).
* **Legend:**
* Blue circles: (Implied from panel b, representing "Superfluid").
* Orange squares: "randomized".
### Detailed Analysis
**Panel (a) - Physical Setup**
The diagram depicts a time-of-flight measurement. An atomic cloud of size $L$ expands and falls 43 cm onto a single-atom detector. The inset illustrates the momentum space resolution, where the detector resolves momentum with a precision of $\delta k$, and the cloud's spatial extent $L$ corresponds to a momentum width of $1/L$.
**Panel (b) - Correlation Data**
* **Mott Insulator (Gray Squares):** The data points follow the solid black line representing $n!$ (factorial growth).
* $n=1$: $g^{(1)}(0) \approx 1$
* $n=2$: $g^{(2)}(0) \approx 2$
* $n=3$: $g^{(3)}(0) \approx 7$
* $n=4$: $g^{(4)}(0) \approx 30$
* $n=5$: $g^{(5)}(0) \approx 150$
* $n=6$: $g^{(6)}(0) \approx 700$
* **Superfluid (Blue Circles):** The data points remain nearly constant at $g^{(n)}(0) \approx 1$ across all orders $n$.
**Panel (c) - Zoomed Data**
This panel provides a higher-resolution view of the superfluid data and introduces a "randomized" control.
* **Randomized (Orange Squares):** Remains perfectly flat at $g^{(n)}(0) = 1.0$ for all $n$.
* **Superfluid (Blue Circles):** Shows a slight, progressive upward trend as $n$ increases:
* $n=1$: $\approx 1.00$
* $n=2$: $\approx 1.01$
* $n=3$: $\approx 1.03$
* $n=4$: $\approx 1.05$
* $n=5$: $\approx 1.09$
* $n=6$: $\approx 1.12$
### Key Observations
* **Mott Insulator Behavior:** The Mott insulator state exhibits strong bunching, characterized by factorial growth ($n!$), which is a hallmark of thermal or chaotic statistics.
* **Superfluid Behavior:** The superfluid state is largely coherent, staying close to $g^{(n)}(0) = 1$ (Poissonian statistics). However, the zoom in panel (c) reveals a small but statistically significant deviation from 1 as the order of correlation increases.
* **Control:** The "randomized" data serves as a baseline, confirming that the detector and analysis pipeline do not introduce artificial correlations (it stays flat at 1.0).
### Interpretation
The data demonstrates the fundamental difference in quantum statistical properties between a Mott insulator and a superfluid in an ultracold atomic gas.
* The **Mott insulator** acts like a thermal source, where atoms are uncorrelated and exhibit "bunching" (the probability of detecting multiple atoms simultaneously is higher than for a random distribution).
* The **Superfluid** acts like a coherent state (similar to a laser), where atoms are uncorrelated in a way that results in Poissonian statistics ($g^{(n)}(0) = 1$).
* The slight upward trend in the superfluid data in panel (c) suggests that the experimental superfluid is not a "perfect" coherent state. This is likely due to finite-size effects, thermal fluctuations, or experimental imperfections that introduce small amounts of bunching, which become more pronounced at higher correlation orders. The "randomized" control confirms that the observed deviation in the superfluid data is a physical property of the state, not an artifact of the measurement system.