## [Composite Image: Diagram + Two Graphs]: Atomic Correlation Measurement Setup and Data
### Overview
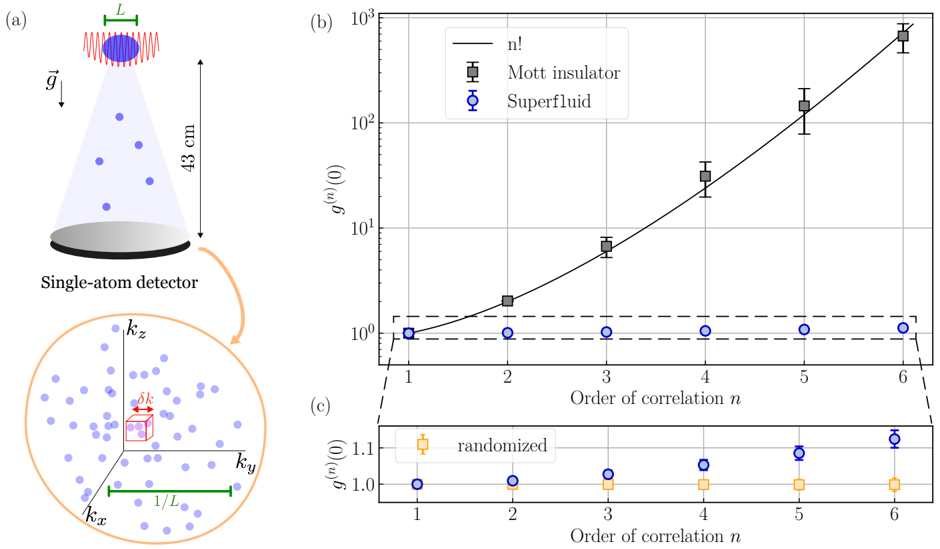
The image contains three panels:
- **(a)** A schematic diagram of an experimental setup for single-atom detection (with momentum-space representation).
- **(b)** A logarithmic graph of correlation functions \( g^{(n)}(0) \) vs. correlation order \( n \).
- **(c)** A zoomed linear graph of the lower region of (b), focusing on weak correlations.
### Components/Axes
#### Panel (a) – Diagram (Experimental Setup)
- **Top Section**: A blue spherical cloud (labeled with length \( L \)) with a red oscillating wave (likely a laser) above it. Below, a conical distribution of blue dots (atoms) falls toward a *“Single-atom detector”* (black disk) with a vertical distance of \( 43 \, \text{cm} \). A downward arrow labeled \( \vec{g} \) (gravity) indicates the direction of fall.
- **Bottom Section (Zoomed k-space)**: A circular inset with axes \( k_x \), \( k_y \), \( k_z \) (momentum space). A red cube (volume element) with \( \delta k \) (momentum uncertainty) is shown, and a green bar labeled \( 1/L \) (inverse length scale) spans the \( k_x \) axis. Blue dots represent atoms in momentum space.
#### Panel (b) – Graph (Correlation Functions)
- **X-axis**: *“Order of correlation \( n \)”* (values: 1, 2, 3, 4, 5, 6).
- **Y-axis**: \( g^{(n)}(0) \) (logarithmic scale, range \( 10^0 \) to \( 10^3 \)).
- **Legend**:
- Black line: \( n! \) (factorial function).
- Gray squares: *“Mott insulator”* (data points with error bars).
- Blue circles: *“Superfluid”* (data points).
#### Panel (c) – Zoomed Graph (Weak Correlations)
- **X-axis**: *“Order of correlation \( n \)”* (same as (b)).
- **Y-axis**: \( g^{(n)}(0) \) (linear scale, range 1.0 to 1.1).
- **Legend**:
- Orange squares: *“randomized”* (data points).
- Blue circles: *“Superfluid”* (data points, same as (b)).
### Detailed Analysis
#### Panel (a) – Diagram
The setup depicts a cloud of atoms (blue sphere) released from a trap (red wave, length \( L \)) and falling under gravity (\( \vec{g} \)) over \( 43 \, \text{cm} \) to a single-atom detector. The zoomed k-space inset shows the momentum distribution of atoms, with a volume element \( \delta k \) and a length scale \( 1/L \) (relating to the trap size \( L \)).
#### Panel (b) – Graph
- **Mott Insulator (gray squares)**: Data points follow the \( n! \) line (black) closely. For \( n=1 \), \( g^{(1)}(0) \approx 1 \); \( n=2 \), \( \approx 2 \); \( n=3 \), \( \approx 6 \); \( n=4 \), \( \approx 24 \); \( n=5 \), \( \approx 120 \); \( n=6 \), \( \approx 720 \) (consistent with \( n! \)). Error bars indicate experimental uncertainty.
- **Superfluid (blue circles)**: Data points are flat around \( g^{(n)}(0) \approx 1 \) for all \( n \), with small error bars.
#### Panel (c) – Zoomed Graph
- **Superfluid (blue circles)**: Slight increase with \( n \): \( n=1 \approx 1.0 \), \( n=2 \approx 1.0 \), \( n=3 \approx 1.02 \), \( n=4 \approx 1.05 \), \( n=5 \approx 1.08 \), \( n=6 \approx 1.1 \) (approximate values).
- **Randomized (orange squares)**: Flat around \( g^{(n)}(0) \approx 1.0 \) for all \( n \), with minimal variation.
### Key Observations
- **Mott Insulator vs. Superfluid**: Mott insulator correlation functions follow \( n! \), indicating strong correlations (consistent with a Mott insulating state, where particles are localized). Superfluid correlation functions are near 1, suggesting weak or no correlations (consistent with a superfluid state, where particles are delocalized).
- **Randomized Data**: The “randomized” data (orange squares) is flat, serving as a control (no correlations), contrasting with the superfluid’s slight increase.
- **Diagram (a)**: The setup shows a time-of-flight or momentum-space measurement, with the detector capturing atoms after falling, and the k-space inset illustrating the momentum distribution.
### Interpretation
- **Diagram (a)**: This is an experimental setup for measuring atomic correlations, likely using a single-atom detector to count atoms in momentum space. The length \( L \) and distance \( 43 \, \text{cm} \) suggest a time-of-flight experiment, where atoms fall and their momentum is inferred from their position.
- **Graph (b)**: The Mott insulator’s \( g^{(n)}(0) \) following \( n! \) implies that the probability of finding \( n \) atoms in the same state is proportional to \( n! \), a signature of strong correlations (e.g., in a Mott insulator, where each site has exactly one atom, leading to factorial correlations). The superfluid’s flat \( g^{(n)}(0) \approx 1 \) suggests Poissonian statistics (uncorrelated particles), typical of a superfluid where particles are delocalized and uncorrelated.
- **Graph (c)**: The zoomed view shows the superfluid has a slight increase in \( g^{(n)}(0) \) with \( n \), possibly indicating weak correlations or experimental noise, while the randomized data (control) is flat, confirming that the superfluid’s behavior is distinct from random.
(No non-English text is present; all labels and text are in English.)