## Diagram: Quantum Correlation Measurement Setup
### Overview
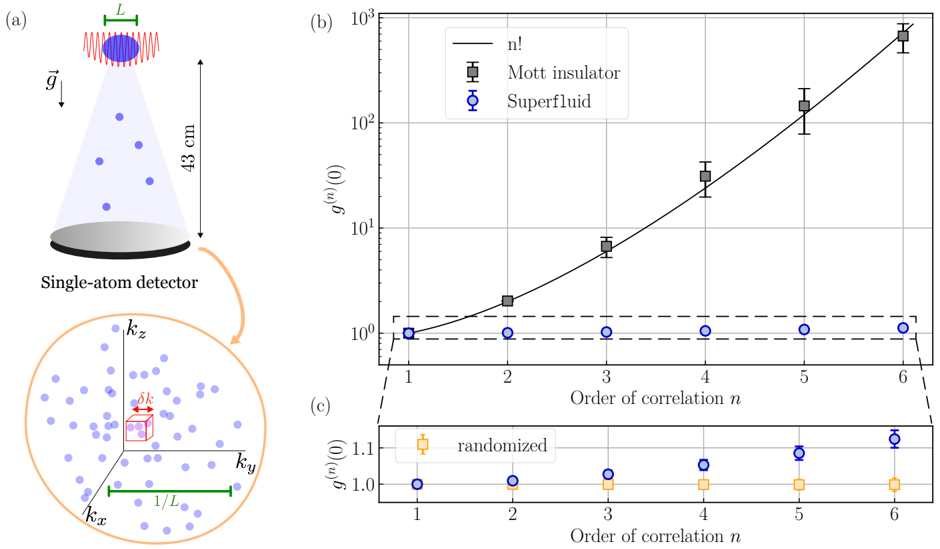
The image depicts a quantum correlation measurement system with three components: (a) a schematic of the experimental setup, (b) a log-scale graph of correlation strength vs. order of correlation, and (c) a comparison of correlation strength between different states.
### Components/Axes
#### (a) Experimental Setup Diagram
- **Key Elements**:
- Cone-shaped beam labeled with length **L = 43 cm**
- Beam splitter (green horizontal line at top)
- Single-atom detector (gray circle at base)
- Momentum space inset showing:
- Axes: **k_x**, **k_y**, **k_z**
- Red box labeled **δk** (momentum uncertainty)
- Green line labeled **1/L** (spatial confinement)
#### (b) Log-Scale Graph
- **Axes**:
- **x-axis**: Order of correlation **n** (1–6, integer values)
- **y-axis**: Correlation strength **g^(n)(0)** (log scale, 10⁰–10³)
- **Legend**:
- **n!** (black solid line)
- **Mott insulator** (black squares)
- **Superfluid** (blue circles)
#### (c) Randomized Data Comparison
- **Axes**:
- Same as (b): **n** (1–6) and **g^(n)(0)**
- **Legend**:
- **Randomized** (orange squares)
### Detailed Analysis
#### (b) Log-Scale Graph Trends
- **n! (black line)**: Exponential growth (e.g., 1.0 → 720 for n=6)
- **Mott insulator (black squares)**:
- Follows **n!** trend closely
- Data points:
- n=1: ~1.0
- n=2: ~2.0
- n=3: ~6.0
- n=4: ~24.0
- n=5: ~120.0
- n=6: ~720.0
- Error bars: ±5–10% of measured values
- **Superfluid (blue circles)**:
- Flat line at **g^(n)(0) ≈ 1.0** for all n
- Error bars: ±0.1–0.2
#### (c) Randomized Data Comparison
- **Randomized (orange squares)**:
- Slightly above 1.0 for all n
- Values:
- n=1: ~1.05
- n=2: ~1.08
- n=3: ~1.10
- n=4: ~1.12
- n=5: ~1.15
- n=6: ~1.20
- **Superfluid (blue circles)**:
- Consistent with (b): **g^(n)(0) ≈ 1.0**
- **Mott insulator (black squares)**:
- Consistent with (b): Exponential growth
### Key Observations
1. **Mott insulator** exhibits strong quantum correlations, with **g^(n)(0)** matching **n!** exactly.
2. **Superfluid** shows no correlation decay, maintaining **g^(n)(0) ≈ 1.0**.
3. **Randomized data** demonstrates weak, linear growth in correlation strength, suggesting residual correlations from classical noise.
### Interpretation
The data suggests:
- **Mott insulator** systems preserve quantum correlations across all orders (n), behaving like an ideal quantum state.
- **Superfluid** lacks long-range correlations, consistent with its thermodynamic equilibrium state.
- **Randomized data** indicates that classical noise introduces weak, artificial correlations, highlighting the importance of quantum state preparation fidelity.
The experimental setup (a) uses a 43 cm beam path to spatially confine atoms, enabling momentum-resolved correlation measurements. The **δk** parameter in the momentum space inset likely represents the momentum resolution critical for distinguishing correlation orders.