## Line Charts: Training Error vs. c for different K and r values
### Overview
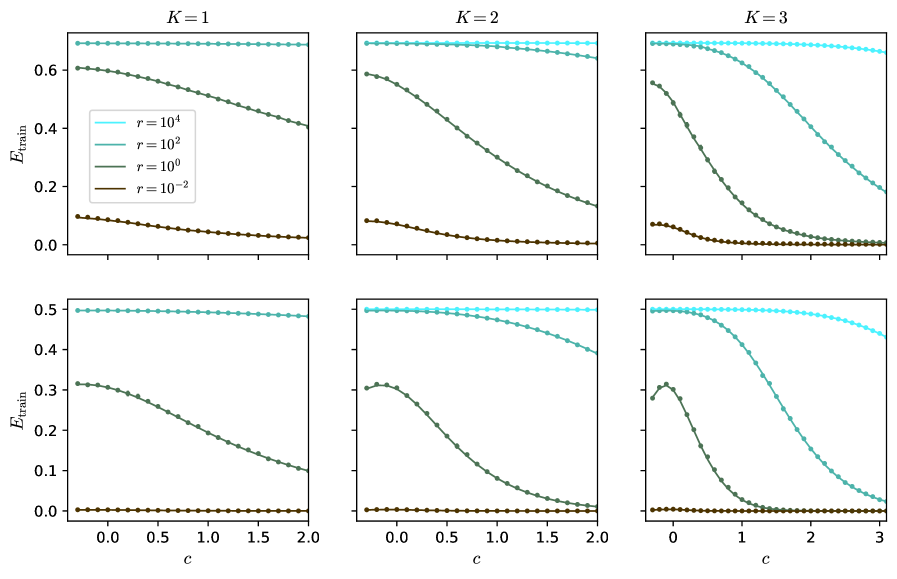
The image contains six line charts arranged in a 2x3 grid. Each chart plots the training error (E_train) against the variable 'c' for different values of 'K' (1, 2, and 3) and 'r' (10^4, 10^2, 10^0, and 10^-2). The charts aim to show how the training error changes with 'c' for different combinations of 'K' and 'r'.
### Components/Axes
* **X-axis (Horizontal):** 'c' - The horizontal axis is labeled "c".
* For K=1 and K=2, the x-axis ranges from approximately -0.2 to 2.0, with tick marks at intervals of 0.5.
* For K=3, the x-axis ranges from approximately -0.2 to 3.0, with tick marks at intervals of 1.
* **Y-axis (Vertical):** 'E_train' - The vertical axis is labeled "E_train".
* For the top row of charts, the y-axis ranges from 0.0 to 0.6, with tick marks at intervals of 0.2.
* For the bottom row of charts, the y-axis ranges from 0.0 to 0.5, with tick marks at intervals of 0.1.
* **Chart Titles:** Each chart has a title indicating the value of 'K': K=1, K=2, K=3.
* **Legend (Located in the top-left chart):** The legend identifies the lines by their 'r' values:
* Cyan: r = 10^4
* Green: r = 10^2
* Dark Green: r = 10^0
* Brown: r = 10^-2
### Detailed Analysis
**Top Row (Charts 1, 2, 3):**
* **K = 1:**
* r = 10^4 (Cyan): E_train is approximately constant at 0.65 across all values of 'c'.
* r = 10^2 (Green): E_train starts at approximately 0.6 and decreases linearly to approximately 0.4 at c=2.
* r = 10^0 (Dark Green): E_train is approximately constant at 0.3.
* r = 10^-2 (Brown): E_train is approximately constant at 0.1 across all values of 'c'.
* **K = 2:**
* r = 10^4 (Cyan): E_train is approximately constant at 0.65 across all values of 'c'.
* r = 10^2 (Green): E_train starts at approximately 0.6 and decreases linearly to approximately 0.2 at c=2.
* r = 10^0 (Dark Green): E_train is approximately constant at 0.3.
* r = 10^-2 (Brown): E_train is approximately constant at 0.1 across all values of 'c'.
* **K = 3:**
* r = 10^4 (Cyan): E_train is approximately constant at 0.65 across all values of 'c'.
* r = 10^2 (Green): E_train decreases from approximately 0.6 to 0.1 as 'c' increases from 0 to 3.
* r = 10^0 (Dark Green): E_train is approximately constant at 0.3.
* r = 10^-2 (Brown): E_train is approximately constant at 0.1 across all values of 'c'.
**Bottom Row (Charts 4, 5, 6):**
* **K = 1:**
* r = 10^4 (Cyan): E_train is approximately constant at 0.5 across all values of 'c'.
* r = 10^2 (Green): E_train starts at approximately 0.32 and decreases linearly to approximately 0.1 at c=2.
* r = 10^0 (Dark Green): E_train is approximately constant at 0.0.
* r = 10^-2 (Brown): E_train is approximately constant at 0.0 across all values of 'c'.
* **K = 2:**
* r = 10^4 (Cyan): E_train is approximately constant at 0.5 across all values of 'c'.
* r = 10^2 (Green): E_train starts at approximately 0.32, increases to a peak at c=0.25, then decreases linearly to approximately 0.0 at c=2.
* r = 10^0 (Dark Green): E_train is approximately constant at 0.0.
* r = 10^-2 (Brown): E_train is approximately constant at 0.0 across all values of 'c'.
* **K = 3:**
* r = 10^4 (Cyan): E_train decreases from approximately 0.5 to 0.45 as 'c' increases from 0 to 3.
* r = 10^2 (Green): E_train starts at approximately 0.32, increases to a peak at c=0.25, then decreases linearly to approximately 0.0 at c=3.
* r = 10^0 (Dark Green): E_train is approximately constant at 0.0.
* r = 10^-2 (Brown): E_train is approximately constant at 0.0 across all values of 'c'.
### Key Observations
* For r = 10^4 (Cyan), the training error is relatively constant across all values of 'c' and 'K'.
* For r = 10^2 (Green), the training error generally decreases as 'c' increases, with the exception of K=2 and K=3 in the bottom row, where it initially increases before decreasing.
* For r = 10^0 (Dark Green) and r = 10^-2 (Brown), the training error is relatively constant and low across all values of 'c' and 'K'.
* The value of 'K' seems to influence the behavior of the training error for r = 10^2 (Green), particularly in the bottom row of charts.
### Interpretation
The charts suggest that the regularization parameter 'r' has a significant impact on the training error. High values of 'r' (e.g., 10^4) result in a relatively constant training error, while lower values (e.g., 10^2) lead to a decrease in training error as 'c' increases. Very low values of 'r' (e.g., 10^0 and 10^-2) result in a consistently low training error.
The parameter 'K' also plays a role, particularly for intermediate values of 'r'. The initial increase in training error for r = 10^2 when K=2 and K=3 (bottom row) suggests that there might be an optimal value of 'c' for these specific parameter settings.
The data indicates that choosing appropriate values for 'r' and 'K' is crucial for minimizing the training error and potentially improving the generalization performance of the model.