## Chart: Training Error vs. Regularization Parameter
### Overview
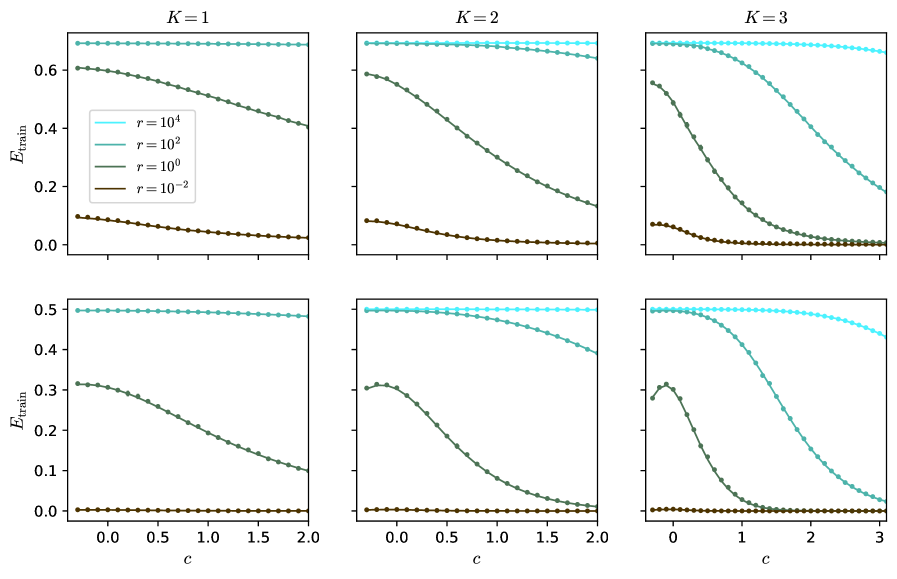
The image presents a 2x3 grid of line charts, each depicting the relationship between training error (E_train) and a regularization parameter 'c' for different values of 'K' (1, 2, and 3) and 'r' (10^4, 10^2, 10^0, and 10^-2). Each chart shows multiple lines representing different values of 'r' for a fixed 'K'. The top row shows charts with a c-axis ranging from 0 to 2, while the bottom row extends to c=3 for K=3.
### Components/Axes
* **X-axis:** 'c' (Regularization Parameter) - Scale varies between charts, ranging from 0 to 2 (top row) and 0 to 3 (bottom row).
* **Y-axis:** 'E_train' (Training Error) - Scale ranges from 0 to 0.65.
* **Legend:** Located in the top-left corner of each chart, identifying the lines by 'r' values:
* r = 10^4 (Light Blue)
* r = 10^2 (Gray)
* r = 10^0 (Dark Green)
* r = 10^-2 (Dark Brown)
* **Titles:** Each chart is labeled with 'K = 1', 'K = 2', or 'K = 3' at the top center.
### Detailed Analysis or Content Details
**Chart 1: K = 1**
* **r = 10^4 (Light Blue):** Line is nearly flat, starting at approximately 0.63 and decreasing very slightly to around 0.61 as 'c' increases from 0 to 2.
* **r = 10^2 (Gray):** Line slopes downward, starting at approximately 0.22 and decreasing to around 0.05 as 'c' increases from 0 to 2.
* **r = 10^0 (Dark Green):** Line slopes downward, starting at approximately 0.10 and decreasing to around 0.02 as 'c' increases from 0 to 2.
* **r = 10^-2 (Dark Brown):** Line is relatively flat, starting at approximately 0.03 and remaining around 0.02 as 'c' increases from 0 to 2.
**Chart 2: K = 2**
* **r = 10^4 (Light Blue):** Line slopes downward, starting at approximately 0.65 and decreasing to around 0.15 as 'c' increases from 0 to 2.
* **r = 10^2 (Gray):** Line slopes downward, starting at approximately 0.25 and decreasing to around 0.05 as 'c' increases from 0 to 2.
* **r = 10^0 (Dark Green):** Line slopes downward, starting at approximately 0.20 and decreasing to around 0.05 as 'c' increases from 0 to 2.
* **r = 10^-2 (Dark Brown):** Line is relatively flat, starting at approximately 0.05 and remaining around 0.03 as 'c' increases from 0 to 2.
**Chart 3: K = 3**
* **r = 10^4 (Light Blue):** Line initially decreases, reaching a minimum around c=1.5 (approximately 0.25), then increases to around 0.35 at c=3.
* **r = 10^2 (Gray):** Line slopes downward, starting at approximately 0.35 and decreasing to around 0.10 as 'c' increases from 0 to 2. It then increases slightly to around 0.12 at c=3.
* **r = 10^0 (Dark Green):** Line initially decreases, reaching a minimum around c=1.5 (approximately 0.10), then increases to around 0.15 at c=3.
* **r = 10^-2 (Dark Brown):** Line initially decreases, reaching a minimum around c=2 (approximately 0.05), then increases to around 0.08 at c=3.
### Key Observations
* For K=1 and K=2, increasing 'c' generally decreases the training error for all values of 'r'.
* For K=3, the training error initially decreases with 'c', but then increases beyond a certain point (around c=1.5-2). This suggests overfitting for larger values of 'c' when K=3.
* Higher values of 'r' (10^4) consistently result in higher training errors compared to lower values of 'r' (10^-2), especially for K=1 and K=2.
* The effect of 'r' on training error is less pronounced for K=3, particularly at higher values of 'c'.
### Interpretation
The charts illustrate the impact of regularization (parameter 'c') on training error for different values of 'K' and 'r'. The parameter 'K' likely represents the number of components or clusters in a model, while 'r' could be a regularization strength parameter.
The decreasing trend of training error with increasing 'c' for K=1 and K=2 indicates that regularization helps prevent overfitting. However, the increase in training error for K=3 at higher 'c' values suggests that excessive regularization can lead to underfitting.
The influence of 'r' on training error suggests that a larger 'r' (stronger regularization) can lead to higher training error, potentially due to a more constrained model. The optimal value of 'c' and 'r' likely depends on the specific value of 'K' and the complexity of the underlying data. The charts demonstrate a trade-off between bias and variance, where increasing 'c' reduces variance but can increase bias, and vice versa. The charts suggest that the optimal regularization strength is dependent on the complexity of the model (K).