## [Chart Type]: Dual Line Charts Comparing Agent Performance
### Overview
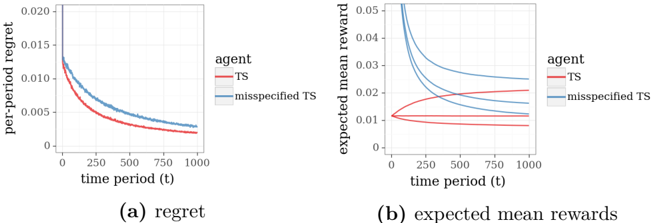
The image displays two side-by-side line charts, labeled (a) and (b), comparing the performance of two agents—"TS" and "misspecified TS"—over 1000 time periods. The charts illustrate metrics related to regret and expected mean rewards in what appears to be a reinforcement learning or bandit algorithm context.
### Components/Axes
**Common Elements:**
* **X-axis (both charts):** Labeled "time period (t)". The axis is linear, with major tick marks at 0, 250, 500, 750, and 1000.
* **Legend (both charts):** Positioned to the right of each plot. It contains two entries:
* A red line labeled "TS".
* A blue line labeled "misspecified TS".
**Chart (a) - Left:**
* **Title/Caption:** "(a) regret" (located below the chart).
* **Y-axis:** Labeled "per-period regret". The scale is linear, with major tick marks at 0, 0.005, 0.010, 0.015, and 0.020.
**Chart (b) - Right:**
* **Title/Caption:** "(b) expected mean rewards" (located below the chart).
* **Y-axis:** Labeled "expected mean reward". The scale is linear, with major tick marks at 0, 0.01, 0.02, 0.03, 0.04, and 0.05.
### Detailed Analysis
**Chart (a): Regret**
* **Trend Verification:** Both lines show a clear, monotonic decreasing trend as time period (t) increases. The red line ("TS") is consistently below the blue line ("misspecified TS") for the entire duration.
* **Data Points (Approximate):**
* **TS (Red Line):** Starts at approximately 0.013 at t=0. Decreases rapidly initially, then more gradually. At t=250, value ≈ 0.006. At t=500, value ≈ 0.004. At t=1000, value ≈ 0.002.
* **misspecified TS (Blue Line):** Starts at approximately 0.018 at t=0. Follows a similar decay shape but remains above the red line. At t=250, value ≈ 0.009. At t=500, value ≈ 0.006. At t=1000, value ≈ 0.003.
**Chart (b): Expected Mean Rewards**
* **Trend Verification:**
* **TS (Red Lines):** There appear to be multiple red lines (likely representing different runs or confidence bounds). They are tightly clustered and show a very slight, gradual increase over time, remaining relatively stable around the 0.01 level.
* **misspecified TS (Blue Lines):** There are also multiple blue lines. They start at a much higher value (≈0.05) and show a steep, concave decreasing trend, converging towards the cluster of red lines as time increases.
* **Data Points (Approximate):**
* **TS (Red Cluster):** Values range between approximately 0.008 and 0.012 across the entire time period, with a very slight upward slope.
* **misspecified TS (Blue Lines):** The highest blue line starts at ≈0.05 at t=0 and drops to ≈0.015 by t=1000. The lowest blue line starts at ≈0.035 and drops to ≈0.012 by t=1000. All blue lines are converging towards the red cluster.
### Key Observations
1. **Performance Gap in Regret:** The "TS" agent consistently achieves lower per-period regret than the "misspecified TS" agent throughout the entire learning period.
2. **Initial Overestimation in Rewards:** The "misspecified TS" agent begins with a significantly higher expected mean reward (over 3x higher) than the "TS" agent, but this advantage erodes completely over time.
3. **Convergence of Rewards:** The expected mean rewards for the "misspecified TS" agent converge towards the stable, lower reward level of the "TS" agent by the end of the 1000 periods.
4. **Stability vs. Volatility:** The "TS" agent shows stable, predictable performance in both metrics. The "misspecified TS" agent shows high initial reward volatility that dampens over time.
### Interpretation
The data suggests a classic trade-off or consequence of model misspecification in sequential decision-making algorithms (like Thompson Sampling, "TS").
* **What the data demonstrates:** The "misspecified TS" agent likely operates with an incorrect internal model of the environment. This leads it to initially overestimate the rewards of its actions (Chart b), causing it to explore aggressively or exploit seemingly high rewards. This overestimation results in higher regret (Chart a) because its actions are suboptimal based on the true environment.
* **Relationship between elements:** The high initial blue line in Chart (b) is the direct cause of the higher blue line in Chart (a). The agent's mistaken belief in high rewards leads to poor decisions, which manifest as regret. As the agent gathers more data over time (t increases), its model may be updated, causing its reward estimates to converge towards the true values (the red cluster in Chart b). Consequently, its per-period regret also decreases, though it never catches up to the correctly specified "TS" agent.
* **Notable Anomaly/Insight:** The most striking finding is the complete erosion of the initial reward advantage. It indicates that while misspecification can lead to short-term, illusory gains, it is detrimental to long-term performance and efficiency, as measured by cumulative regret. The "TS" agent, with a correct model, learns the optimal policy more efficiently from the start.