## Line Graphs: Agent Performance Metrics Over Time
### Overview
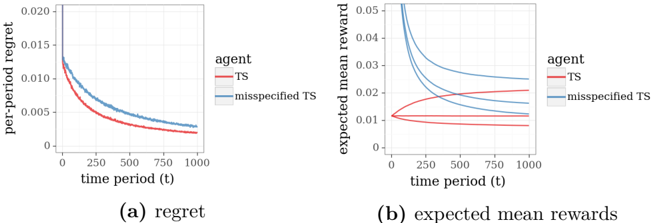
The image contains two line graphs comparing the performance of two agents: "TS" (red) and "misspecified TS" (blue) across 1,000 time periods. The left graph (a) measures "per-period regret," while the right graph (b) measures "expected mean rewards." Both graphs show distinct trends for the two agents, with the TS agent generally outperforming the misspecified TS in regret minimization and maintaining more stable rewards.
---
### Components/Axes
#### Graph (a): Regret
- **X-axis**: Time period (t), ranging from 0 to 1,000.
- **Y-axis**: Per-period regret, ranging from 0 to 0.02.
- **Legend**:
- Red line: "TS" (True Success agent).
- Blue line: "misspecified TS" (agent with incorrect assumptions).
- **Title**: "regret" (bold, centered below the graph).
#### Graph (b): Expected Mean Rewards
- **X-axis**: Time period (t), ranging from 0 to 1,000.
- **Y-axis**: Expected mean reward, ranging from 0 to 0.05.
- **Legend**:
- Red line: "TS".
- Blue line: "misspecified TS".
- **Title**: "expected mean rewards" (bold, centered below the graph).
---
### Detailed Analysis
#### Graph (a): Regret
- **TS (Red Line)**:
- Starts at approximately **0.015** at t=0.
- Decreases monotonically, reaching **~0.002** by t=1,000.
- Slope: Steady, smooth decline.
- **Misspecified TS (Blue Line)**:
- Starts at **~0.02** at t=0.
- Decreases more gradually, reaching **~0.003** by t=1,000.
- Slope: Slightly less steep than TS, with minor fluctuations.
- **Key Difference**: The blue line remains consistently above the red line throughout, indicating higher regret for the misspecified TS.
#### Graph (b): Expected Mean Rewards
- **TS (Red Line)**:
- Starts at **~0.01** at t=0.
- Increases slightly to **~0.015** by t=1,000.
- Slope: Gentle upward trend.
- **Misspecified TS (Blue Line)**:
- Starts at **~0.03** at t=0.
- Dips to **~0.01** around t=500, then rises to **~0.025** by t=1,000.
- Slope: Volatile, with a sharp decline followed by recovery.
- **Key Difference**: The blue line exhibits significant volatility, dipping below the red line around t=500 before recovering.
---
### Key Observations
1. **Regret Minimization**: The TS agent achieves lower regret over time compared to the misspecified TS, suggesting better decision-making efficiency.
2. **Reward Stability**: The TS agent’s rewards increase steadily, while the misspecified TS experiences a sharp drop and partial recovery, indicating instability.
3. **Performance Gap**: By t=1,000, the TS agent’s regret is **~0.002** (75% lower than initial) vs. **~0.003** for the misspecified TS. Rewards for TS reach **~0.015**, while misspecified TS ends at **~0.025** but with higher variability.
---
### Interpretation
- **Agent Effectiveness**: The TS agent demonstrates superior performance in both minimizing regret and maximizing rewards, likely due to accurate assumptions or better adaptation to the environment.
- **Misspecified TS Limitations**: The misspecified TS incurs higher regret and suffers from reward instability, possibly due to flawed initial assumptions or suboptimal exploration strategies.
- **Temporal Dynamics**: The misspecified TS’s reward dip around t=500 suggests a critical failure point, potentially from over-reliance on incorrect assumptions. Its partial recovery by t=1,000 may indicate adaptive adjustments, but at the cost of sustained inefficiency.
This analysis highlights the importance of accurate model specification in reinforcement learning agents, as even minor deviations can lead to significant performance gaps over time.