## Line Chart: Mean Pass Rate vs. Mean Number of Tokens Generated
### Overview
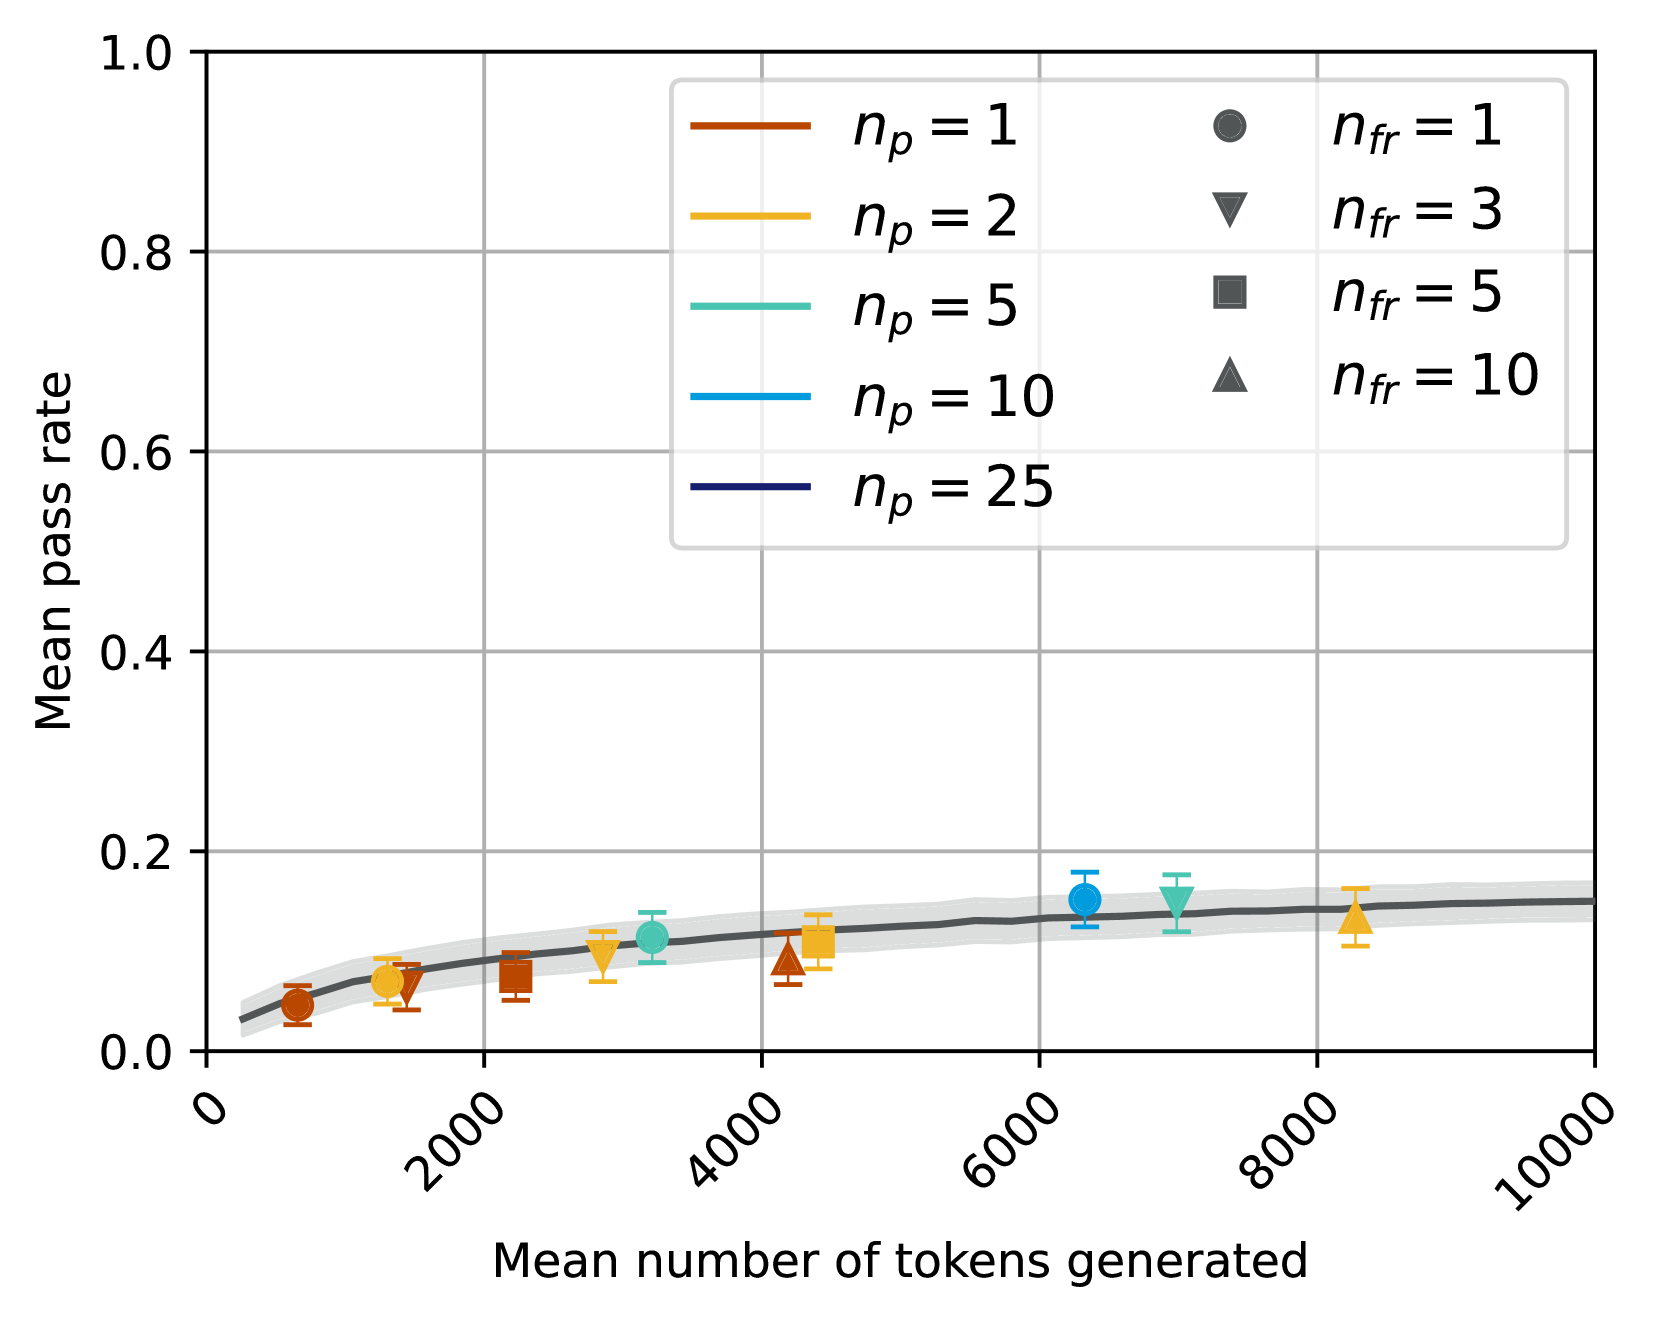
The image is a line chart showing the relationship between the mean pass rate and the mean number of tokens generated. The chart includes data series for different values of 'np' (represented by lines) and 'nfr' (represented by markers). Error bars are present on the data points. A shaded region indicates uncertainty.
### Components/Axes
* **X-axis:** "Mean number of tokens generated". The scale ranges from 0 to 10000, with tick marks at intervals of 2000.
* **Y-axis:** "Mean pass rate". The scale ranges from 0.0 to 1.0, with tick marks at intervals of 0.2.
* **Legend (Top-Left):**
* Brown line: `np = 1`
* Yellow line: `np = 2`
* Teal line: `np = 5`
* Cyan line: `np = 10`
* Dark Blue line: `np = 25`
* **Legend (Top-Right):**
* Gray circle: `nfr = 1`
* Gray inverted triangle: `nfr = 3`
* Gray square: `nfr = 5`
* Gray triangle: `nfr = 10`
### Detailed Analysis
* **General Trend:** The mean pass rate generally increases as the mean number of tokens generated increases. The rate of increase appears to diminish as the number of tokens generated gets larger.
* **Data Series Analysis:**
* **nfr = 1 (Gray Circle):** Starts at approximately (0, 0.04), increases to approximately (6000, 0.15), and ends around (8000, 0.14).
* **nfr = 3 (Gray Inverted Triangle):** Starts at approximately (1500, 0.07), increases to approximately (6000, 0.15), and ends around (8000, 0.15).
* **nfr = 5 (Gray Square):** Starts at approximately (2500, 0.08), increases to approximately (6000, 0.14), and ends around (7000, 0.15).
* **nfr = 10 (Gray Triangle):** Starts at approximately (3500, 0.10), increases to approximately (6000, 0.14), and ends around (8000, 0.14).
* **Error Bars:** Error bars are present on each data point, indicating the uncertainty in the mean pass rate. The error bars appear to be relatively consistent in size across the different data series.
* **Shaded Region:** A gray shaded region surrounds the data points, likely representing a confidence interval or standard deviation.
### Key Observations
* The mean pass rate increases with the mean number of tokens generated, but the rate of increase slows down as the number of tokens increases.
* The different values of 'nfr' do not appear to have a significant impact on the mean pass rate. The data points for different 'nfr' values are clustered closely together.
* The error bars and shaded region indicate a degree of uncertainty in the mean pass rate.
### Interpretation
The chart suggests that increasing the number of tokens generated generally leads to a higher pass rate. However, there appears to be a point of diminishing returns, where generating more tokens does not significantly improve the pass rate. The values of 'nfr' do not seem to have a strong influence on the pass rate, suggesting that other factors may be more important in determining the outcome. The uncertainty in the data, as indicated by the error bars and shaded region, should be considered when interpreting the results.