\n
## Line Chart: Mean Pass Rate vs. Mean Number of Tokens Generated
### Overview
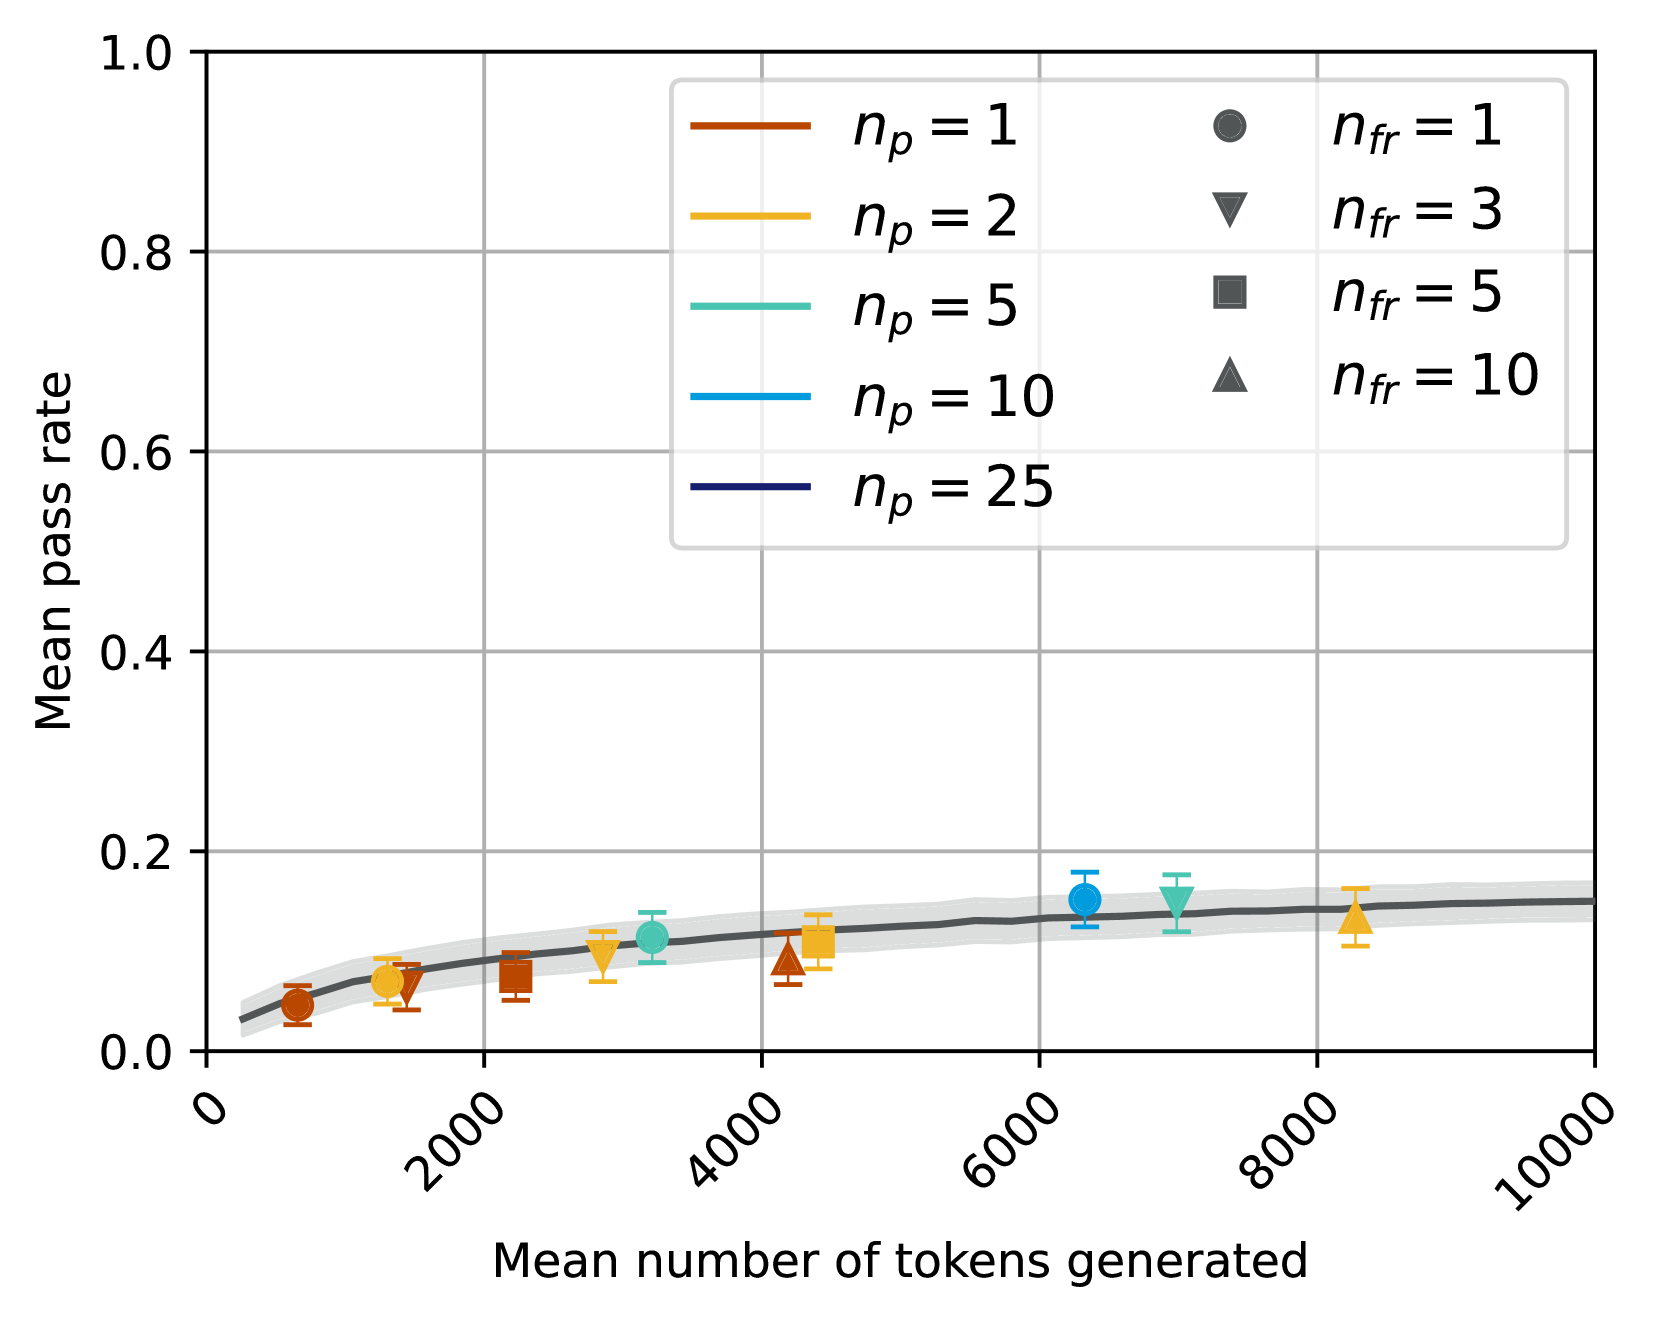
This chart displays the relationship between the mean number of tokens generated and the mean pass rate, for different values of *n<sub>p</sub>* and *n<sub>fr</sub>*. The chart uses line plots with error bars to represent the data, and includes a legend to differentiate between the different values of *n<sub>p</sub>*. The x-axis represents the mean number of tokens generated, ranging from 0 to 10000. The y-axis represents the mean pass rate, ranging from 0 to 1.0.
### Components/Axes
* **X-axis Title:** "Mean number of tokens generated" (Scale: 0 to 10000, linear)
* **Y-axis Title:** "Mean pass rate" (Scale: 0 to 1.0, linear)
* **Legend:** Located in the top-right corner.
* *n<sub>p</sub>* = 1 (Brown line)
* *n<sub>p</sub>* = 2 (Orange line)
* *n<sub>p</sub>* = 5 (Light Green line)
* *n<sub>p</sub>* = 10 (Blue line)
* *n<sub>p</sub>* = 25 (Purple line)
* *n<sub>fr</sub>* = 1 (Gray circle)
* *n<sub>fr</sub>* = 3 (Red triangle)
* *n<sub>fr</sub>* = 5 (Black square)
* *n<sub>fr</sub>* = 10 (Gray triangle)
* **Gridlines:** Present to aid in reading values.
### Detailed Analysis
The chart shows several lines representing different values of *n<sub>p</sub>*. Each line has associated error bars, indicating the variability in the data. The lines generally show a slight upward trend, but the increase is minimal. The data points are sparse, making precise value extraction difficult.
Here's an approximate extraction of data points, noting the uncertainty due to the visual nature of the chart and the error bars:
* **n<sub>p</sub> = 1 (Brown):**
* At 0 tokens: ~0.05 pass rate
* At 2000 tokens: ~0.10 pass rate
* At 4000 tokens: ~0.12 pass rate
* At 8000 tokens: ~0.14 pass rate
* **n<sub>p</sub> = 2 (Orange):**
* At 0 tokens: ~0.05 pass rate
* At 2000 tokens: ~0.12 pass rate
* At 4000 tokens: ~0.14 pass rate
* At 8000 tokens: ~0.15 pass rate
* **n<sub>p</sub> = 5 (Light Green):**
* At 0 tokens: ~0.07 pass rate
* At 2000 tokens: ~0.14 pass rate
* At 4000 tokens: ~0.16 pass rate
* At 8000 tokens: ~0.17 pass rate
* **n<sub>p</sub> = 10 (Blue):**
* At 0 tokens: ~0.08 pass rate
* At 2000 tokens: ~0.15 pass rate
* At 6000 tokens: ~0.18 pass rate
* At 8000 tokens: ~0.19 pass rate
* **n<sub>p</sub> = 25 (Purple):**
* At 0 tokens: ~0.07 pass rate
* At 2000 tokens: ~0.14 pass rate
* At 4000 tokens: ~0.16 pass rate
* At 8000 tokens: ~0.18 pass rate
The gray circles, red triangles, black squares, and gray triangles represent *n<sub>fr</sub>* values of 1, 3, 5, and 10 respectively. These points are scattered across the chart and do not form clear lines. Their values are difficult to extract precisely due to their small size and the presence of error bars.
### Key Observations
* The mean pass rate generally increases with the mean number of tokens generated, but the increase is small.
* Higher values of *n<sub>p</sub>* tend to result in slightly higher mean pass rates.
* The error bars indicate significant variability in the data, making it difficult to draw strong conclusions.
* The *n<sub>fr</sub>* data points appear to be independent of the *n<sub>p</sub>* lines.
### Interpretation
The chart suggests that increasing the number of tokens generated has a limited impact on the mean pass rate. The parameter *n<sub>p</sub>* appears to have a more noticeable, though still modest, effect. The variability in the data, as indicated by the error bars, suggests that other factors may be influencing the pass rate. The scattered *n<sub>fr</sub>* points suggest that this parameter does not have a strong correlation with either the number of tokens generated or the pass rate, or that the relationship is obscured by the variability in the data.
The chart likely represents the performance of a system (e.g., a language model) as it generates text. *n<sub>p</sub>* could represent a parameter related to prompt engineering or decoding strategy, while *n<sub>fr</sub>* could represent a parameter related to filtering or evaluation. The data suggests that optimizing *n<sub>p</sub>* may lead to slight improvements in performance, but that simply generating more tokens does not necessarily guarantee a higher pass rate. Further investigation would be needed to understand the underlying reasons for the observed variability and to identify other factors that may be influencing the pass rate.