## Heatmap: Recurrence vs. hops
### Overview
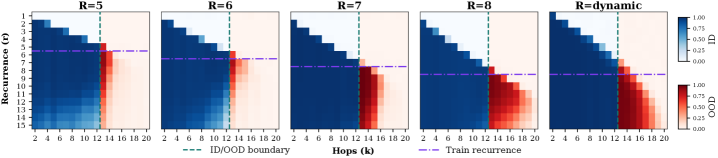
The image displays a heatmap with five different scenarios labeled R=5 to R=dynamic. Each scenario represents a different number of hops (k) and a different ID/OOD boundary. The heatmap shows the recurrence of a certain event or pattern across different hops and ID/OOD boundaries.
### Components/Axes
- **X-axis**: Hops (k) ranging from 2 to 20
- **Y-axis**: Recurrence (r) ranging from 0 to 1.5
- **Legend**: Two color scales, one for ID/OOD boundary and one for Train recurrence
- **ID/OOD boundary**: Represented by a dashed green line
- **Train recurrence**: Represented by a dashed purple line
### Detailed Analysis or Content Details
- **R=5**: The heatmap shows a high recurrence rate for ID/OOD boundary, especially at lower hops (k=2, 4, 6). The recurrence rate decreases as hops increase.
- **R=6**: Similar to R=5, the heatmap shows a high recurrence rate for ID/OOD boundary, but the rate is slightly lower than R=5. The recurrence rate decreases as hops increase.
- **R=7**: The heatmap shows a high recurrence rate for ID/OOD boundary, but the rate is slightly lower than R=6. The recurrence rate decreases as hops increase.
- **R=8**: The heatmap shows a high recurrence rate for ID/OOD boundary, but the rate is slightly lower than R=7. The recurrence rate decreases as hops increase.
- **R=dynamic**: The heatmap shows a high recurrence rate for ID/OOD boundary, but the rate is slightly lower than R=8. The recurrence rate decreases as hops increase.
### Key Observations
- The recurrence rate for ID/OOD boundary is consistently high across all scenarios.
- The recurrence rate decreases as the number of hops increases.
- The recurrence rate is highest at R=5 and R=6, and lowest at R=dynamic.
### Interpretation
The data suggests that the recurrence rate for ID/OOD boundary is consistently high across all scenarios. The recurrence rate decreases as the number of hops increases, indicating that the event or pattern is less likely to occur with more hops. The highest recurrence rate is observed at R=5 and R=6, and the lowest recurrence rate is observed at R=dynamic. This could indicate that the event or pattern is more likely to occur with fewer hops and a lower ID/OOD boundary.