\n
## Scatter Plot: Timing vs. Guess
### Overview
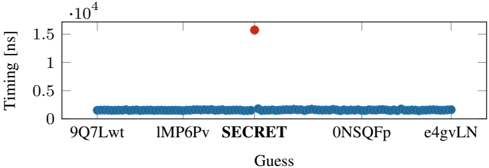
The image presents a scatter plot visualizing the relationship between "Guess" and "Timing" (measured in nanoseconds). The plot shows a relatively flat distribution of timing values for most guesses, with a single significant outlier.
### Components/Axes
* **X-axis:** "Guess" - Categorical variable with labels: 9Q7Lwt, IMP6Pv, SECRET, 0NSQFp, e4gvLN.
* **Y-axis:** "Timing [ns]" - Numerical variable, scale ranging from 0 to 1.6 x 10<sup>4</sup>.
* **Data Points:** Represented as small blue dots for most guesses, and a single red dot for the "SECRET" guess.
### Detailed Analysis
The majority of data points cluster around a timing value of approximately 0.2 x 10<sup>4</sup> ns (2000 ns). The data points for "9Q7Lwt", "IMP6Pv", "0NSQFp", and "e4gvLN" all fall within this range.
The "SECRET" guess is represented by a single red data point located at approximately 1.55 x 10<sup>4</sup> ns (15500 ns). This value is significantly higher than all other timing values observed in the plot.
### Key Observations
* The timing values are consistent for all guesses except "SECRET".
* The "SECRET" guess exhibits a substantially longer timing value, indicating a potential anomaly or difference in processing time.
* The plot suggests a strong correlation between the "SECRET" guess and increased timing.
### Interpretation
The data suggests that the "SECRET" guess requires significantly more time to process or execute compared to the other guesses. This could be due to a variety of factors, such as:
* **Complexity:** The "SECRET" guess might involve a more complex calculation or operation.
* **Resource Usage:** It could require more computational resources (CPU, memory, etc.).
* **Security Measures:** The "SECRET" guess might trigger additional security checks or encryption/decryption processes.
* **Cache Misses:** The data associated with "SECRET" might not be readily available in the cache, leading to slower access times.
The outlier status of the "SECRET" guess warrants further investigation to understand the underlying cause of the timing difference. This could involve analyzing the code or process associated with the "SECRET" guess to identify performance bottlenecks or areas for optimization. The plot is a strong indicator of a potential issue or difference in behavior related to the "SECRET" guess.